---------- ---------- ---------- ---------- ---------- ---------- ---------- ----------
# Let's see how one can easily calculate areas enclosed by curves expressible only in
# Cartesian form (there are also very sophisticated techniques to do with analytical
# methods).
# Let us consider for example the curve x^2 + y^4 + x*y - y^3 = 5
f = function(x,y) x^2+y^4+x*y-y^3-5
BF=4; HF=4
PLANE(-3,3, -3,3)
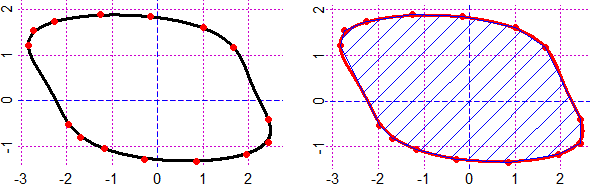
CURVE(f, "black") # I get the figure below to the left (without the red balls)
# With the command startP() I set the program to store the points I click with the
# command, already seen, P().
startP()
P()
# xP <- -2.8371324; yP <- 1.2217254
# And so on, clicking on points that approximate the contour (they are the points
# marked in red, the program marks them in light gray).
 # Points are stored in xClick and yClick, which, if I want, I'll see:
xClick
# -2.8371324, -1.9710328, -1.6954557, -1.1705468, -0.2913244,
# 0.8503524, 1.9526610, 2.4250790, 2.4250790, 1.6639611,
# 1.0078250, -0.1600972, -1.2492831, -2.2597327, -2.7321507
yClick
# 1.2217254, -0.5235966, -0.8122965, -1.0616282, -1.2847145,
# -1.3372053, -1.1797327, -0.9304010, -0.4054921, 1.1692345,
# 1.6022843, 1.8516160, 1.8909842, 1.7335115, 1.5366707
# If I want to see them better I run:
POINT(xClick,yClick,"red")
# At this point I run the command (already seen) areaPol
areaPol(xClick,yClick)
# 12.79085 This is the approximate area of the surface (I take 12.8±0.2)
# If I want, I dot the area of the polygon (see figure above to the right), with polyS
polyS(xClick,yClick,45,"blue")
#
# Or we can have a better approximation using a spline (see):
PLANE(-3,3, -3,3); CURVE(f, "black")
polyS(splineCx(xClick,yClick),splineCy(xClick,yClick),45,"blue")
areaPol(splineCx(xClick,yClick),splineCy(xClick,yClick))
# 13.0773 I take 13.0±0.1
# Points are stored in xClick and yClick, which, if I want, I'll see:
xClick
# -2.8371324, -1.9710328, -1.6954557, -1.1705468, -0.2913244,
# 0.8503524, 1.9526610, 2.4250790, 2.4250790, 1.6639611,
# 1.0078250, -0.1600972, -1.2492831, -2.2597327, -2.7321507
yClick
# 1.2217254, -0.5235966, -0.8122965, -1.0616282, -1.2847145,
# -1.3372053, -1.1797327, -0.9304010, -0.4054921, 1.1692345,
# 1.6022843, 1.8516160, 1.8909842, 1.7335115, 1.5366707
# If I want to see them better I run:
POINT(xClick,yClick,"red")
# At this point I run the command (already seen) areaPol
areaPol(xClick,yClick)
# 12.79085 This is the approximate area of the surface (I take 12.8±0.2)
# If I want, I dot the area of the polygon (see figure above to the right), with polyS
polyS(xClick,yClick,45,"blue")
#
# Or we can have a better approximation using a spline (see):
PLANE(-3,3, -3,3); CURVE(f, "black")
polyS(splineCx(xClick,yClick),splineCy(xClick,yClick),45,"blue")
areaPol(splineCx(xClick,yClick),splineCy(xClick,yClick))
# 13.0773 I take 13.0±0.1
 #
# If I want to find the intersections with the axes I can proceed with some zoom and
# some calculations of the value of f. For example, 2 points are (-2.236068,0) and
# (0,1.823974).
#
# If I want to find the intersections with the axes I can proceed with some zoom and
# some calculations of the value of f. For example, 2 points are (-2.236068,0) and
# (0,1.823974).
 Plane(-2.3,-2.2, -1e-1,1e-1); CURVE(f, "black")
# etc
f(-2.236068, 0)
# 1.00624e-07
f(0, 1.823974)
# -6.51954e-06
Plane(-2.3,-2.2, -1e-1,1e-1); CURVE(f, "black")
# etc
f(-2.236068, 0)
# 1.00624e-07
f(0, 1.823974)
# -6.51954e-06