---------- ---------- ---------- ---------- ---------- ---------- ---------- ----------
# Using BAR2(data,base) I can create bar graphs that do not start from 0
# (I can put noGrid=1 in front of it if I do not want to print the grid)
da<- c(237.5,137.5,125)
BarNames = c("A","B","C"); BAR2(da,0)
# cyan,pink,... 237.5 137.5 125
# cyan,pink,... % 47.5 27.5 25
BarNames = c("A","B","C"); BAR2(da,120)
# cyan,pink,... 237.5 137.5 125
# cyan,pink,... % 47.5 27.5 25
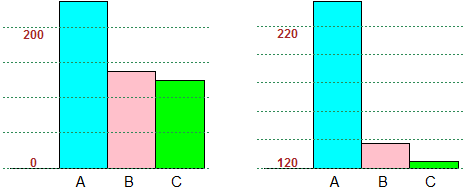 # Obviously, the second representation is deceptive and should be used only
# together with the first when you want to better visualize the values.
Other examples of use
# Obviously, the second representation is deceptive and should be used only
# together with the first when you want to better visualize the values.
Other examples of use