# CURVE(h,…) to build the graph of h(x,y)=0 looks where h changes the sign; if
# h(x,y)≥0 or h(x,y)≤0 everywhere, the graph is not traced. Try then to trace
# that of abs(h(x,y))-eps = 0 with eps very little.
# An easy example to understand:
PLANE(-4,4, -4,4)
g <- function(x,y) x^2+4*y^2-4*x*y; CURVE(g,"green")
# I do not get anything (although in this case I know the curve is
# x-2*y = 0 because x^2+4*y^2-4*x*y = (x-2*y)^2 )
eps <- 1e-4; k <- function(x,y) abs(g(x,y))-eps; CURVE(k,"blue")
 # I can try to do this automatically with the CURVEN (or CURN) command
# ("n" is for "nothing"):
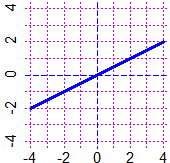
PLANE(-4,4, -4,4)
CURVEN(g,1, "blue") # CURN(g,1, "brown")
#[ y = F(x) +/- 1e-04 ]
# I can try to do this automatically with the CURVEN (or CURN) command
# ("n" is for "nothing"):
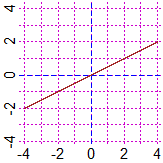
PLANE(-4,4, -4,4)
CURVEN(g,1, "blue") # CURN(g,1, "brown")
#[ y = F(x) +/- 1e-04 ]
 # More precisely the command is CURVEN(g,n,col) (or CURN for a thin line), as
# the following examples explain:
CURN(g,2, "seagreen") ##[ y = F(x) +/- 1e-05 ]
CURN(g,3, "red") #[ y = F(x) +/- 1e-06 ]
CURN(g,-2, "violet") #[ y = F(x) +/- 0.1 ]
# More precisely the command is CURVEN(g,n,col) (or CURN for a thin line), as
# the following examples explain:
CURN(g,2, "seagreen") ##[ y = F(x) +/- 1e-05 ]
CURN(g,3, "red") #[ y = F(x) +/- 1e-06 ]
CURN(g,-2, "violet") #[ y = F(x) +/- 0.1 ]
 # eps is 1e-4 if n=1, 1e-5 if n=2, 1e-3 if n=0, ...
# If eps is too small the two curves y = F(x) +/- eps disappear
# If eps is too large appear separate.
# For an opportune eps just one curve appears.
# eps is 1e-4 if n=1, 1e-5 if n=2, 1e-3 if n=0, ...
# If eps is too small the two curves y = F(x) +/- eps disappear
# If eps is too large appear separate.
# For an opportune eps just one curve appears.