---------- ---------- ---------- ---------- ---------- ---------- ---------- ----------
Examples of distributions
# References for the most common probability distributions are available here:
help("distribution")
#
# I toss up a coin 10 times. What is the law of distribution of the random variable:
# N = "number of heads" ?
# Experimental study:
n = 10000; da = NULL; for (i in 1:n) da[i]=sum(RUNIF(10, 0,1))
hist(da, seq(-0.5,10.5, 1),probability=TRUE,col="grey",main="",cex.axis=0.9)
BOX(); abovex("heads in 10 tosses")
# If I want the histogram on the right I insert in hist(...) ylim=c(0,0.3)
statistics(da) # I get the boxplot and:
# Min. 1st Qu. Median Mean 3rd Qu. Max.
# 0.000 4.000 5.000 4.983 6.000 10.000
 # The theoretical study (for choose see):
N=10; da = NULL; for (i in 0:N) da = c(da,rep(i,choose(10,i)))
hist(da, seq(-0.5,10.5, 1),probability=TRUE,col="grey",main="",cex.axis=0.9)
BOX(); abovex("heads in 10 tosses")
summary(da)
# Min. 1st Qu. Median Mean 3rd Qu. Max.
# 0 4 5 5 6 10
# As index of the data dispersion I can take 3^quartile-1^quartile, ie:
Percentile(da,75)-Percentile(da,25)
[1] 2
# or the standard deviation of "da" (see here)
Sd(da)
# 1.581139
# Using Var (= √Sd) I see that Sd(da) √2.5
Var(da)
# 2.5 It is demonstrable that Var is √N/2
# I recall that these are weighted values. I can proceed also in this way (see here):
j=0:10; Wmean(j,choose(10,j)); WVar(j,choose(10,j))
# 5 2.5
# This is an example of binomial distribution Pr(N=k) = C(n,k)*p^k*(1–p)^(n-k)
# when p = 1/2. In general:
binom = function(m) choose(N,m)*p^m*(1-p)^(N-m)
# An example with p ≠ 1/2.
# An automatic oven produces on average 1 biscuit burnt every 8; biscuits are then
# automatically mixed and packaged in packs of 6. What is the distribution law of the
# random variable N = "n. of burnt cookies in a pack" ?
# It is a discrete probability distribution.
N = 6; p = 1/8; x = 0:N; BC = binom(0:N)
Plane(0,N, 0,max(BC) ); POINT(x,BC, "blue")
# For a better view we add these commands and obtain the following graph, on the left:
polyl(x,BC, "blue"); segm(x,0, x,BC, "blue")
# The theoretical study (for choose see):
N=10; da = NULL; for (i in 0:N) da = c(da,rep(i,choose(10,i)))
hist(da, seq(-0.5,10.5, 1),probability=TRUE,col="grey",main="",cex.axis=0.9)
BOX(); abovex("heads in 10 tosses")
summary(da)
# Min. 1st Qu. Median Mean 3rd Qu. Max.
# 0 4 5 5 6 10
# As index of the data dispersion I can take 3^quartile-1^quartile, ie:
Percentile(da,75)-Percentile(da,25)
[1] 2
# or the standard deviation of "da" (see here)
Sd(da)
# 1.581139
# Using Var (= √Sd) I see that Sd(da) √2.5
Var(da)
# 2.5 It is demonstrable that Var is √N/2
# I recall that these are weighted values. I can proceed also in this way (see here):
j=0:10; Wmean(j,choose(10,j)); WVar(j,choose(10,j))
# 5 2.5
# This is an example of binomial distribution Pr(N=k) = C(n,k)*p^k*(1–p)^(n-k)
# when p = 1/2. In general:
binom = function(m) choose(N,m)*p^m*(1-p)^(N-m)
# An example with p ≠ 1/2.
# An automatic oven produces on average 1 biscuit burnt every 8; biscuits are then
# automatically mixed and packaged in packs of 6. What is the distribution law of the
# random variable N = "n. of burnt cookies in a pack" ?
# It is a discrete probability distribution.
N = 6; p = 1/8; x = 0:N; BC = binom(0:N)
Plane(0,N, 0,max(BC) ); POINT(x,BC, "blue")
# For a better view we add these commands and obtain the following graph, on the left:
polyl(x,BC, "blue"); segm(x,0, x,BC, "blue")
 Wmean(x,BC); WVar(x,BC)
# 0.75 0.65625
# I can prove that I obtain the same valued with:
N*p; N*p*(1-p)
# 0.75 0.65625
# To understand this it is useful to interpret BC as X1+…+X6 where Xi is 1 with proba-
# bility 1/8, is 0 otherwise. With this simulation we obtain the graph on the right.
n=10000; da=NULL; N=6
for(i in 1:n) {X=0; for(j in 1:N) if(runif(1, 0,1)<1/8) X=X+1; da[i]=X}
hist(da, seq(-0.5,N+1/2, 1),probability=TRUE,col="grey",main="",cex.axis=0.9)
BOX(); abovex("burnt cookies in a pack")
# It's clear why the mean is N*p: if every Xi is 1 with probability p X1+… has mean N*p
# NOTE: y = dbinom(x, N, p) is equivalent to x=0:N; ; binom = ...; y = binom(0:N)
# See here for an example of the multinomial distribution.
# When N is large (as in the following example) I can approximate the binomial
# distribution with the gaussian distribution, that we recall dawn.
# The following graph, on the left, is for N=20:
Wmean(x,BC); WVar(x,BC)
# 0.75 0.65625
# I can prove that I obtain the same valued with:
N*p; N*p*(1-p)
# 0.75 0.65625
# To understand this it is useful to interpret BC as X1+…+X6 where Xi is 1 with proba-
# bility 1/8, is 0 otherwise. With this simulation we obtain the graph on the right.
n=10000; da=NULL; N=6
for(i in 1:n) {X=0; for(j in 1:N) if(runif(1, 0,1)<1/8) X=X+1; da[i]=X}
hist(da, seq(-0.5,N+1/2, 1),probability=TRUE,col="grey",main="",cex.axis=0.9)
BOX(); abovex("burnt cookies in a pack")
# It's clear why the mean is N*p: if every Xi is 1 with probability p X1+… has mean N*p
# NOTE: y = dbinom(x, N, p) is equivalent to x=0:N; ; binom = ...; y = binom(0:N)
# See here for an example of the multinomial distribution.
# When N is large (as in the following example) I can approximate the binomial
# distribution with the gaussian distribution, that we recall dawn.
# The following graph, on the left, is for N=20:
 p=0.2; N=20
x=0:N; y=binom(0:N); Plane(0,N, 0,max(y))
POINT(x,y, "blue"); polyl(x,y, "blue"); segm(x,0, x,y, "blue")
m=N*p; v=N*p*(1-p); s=sqrt(v)
# 4 3.2 1.788854
# The distribution rule called normal or gaussian has the following density function f;
# it depends only on 2 parameters, the mean m and σ, called the standard deviation of f.
p=0.2; N=20
x=0:N; y=binom(0:N); Plane(0,N, 0,max(y))
POINT(x,y, "blue"); polyl(x,y, "blue"); segm(x,0, x,y, "blue")
m=N*p; v=N*p*(1-p); s=sqrt(v)
# 4 3.2 1.788854
# The distribution rule called normal or gaussian has the following density function f;
# it depends only on 2 parameters, the mean m and σ, called the standard deviation of f.
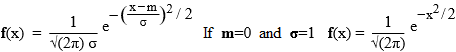 # (σ is the Greek letter "sigma", which corresponds to our "s")
# In R the normal density of mean m and standard deviation s is called
# dnorm(x, mean=m, sd=s). How to obtain the graph above on the right:
z = function(x) dnorm(x, mean=m, sd=s)
x=0:N; y=binom(0:N); Plane(0,N, 0,max(y))
POINT(x,y, "blue")
graph2(z, -20,20, "brown")
# Among the few examples of gaussian phenomenon (in addition to those of the distribu-
# tion of seed lengths already considered - see here), there is the height of the people
# of a particular sex, age, place of origin. Let's use the data already considered here
# (medical examination for a call-up - Italy, 1987):
da = read.table("http://macosa.dima.unige.it/R/callup.txt",skip=8, sep=";",header=TRUE)
str(da)
# 'data.frame': 4170 obs. of 4 variables:
# $ chest : int 91 86 89 88 92 95 91 83 87 88 ...
# $ weight: int 62 64 64 68 70 77 65 62 55 60 ...
# $ region: int 15 15 15 15 15 15 15 15 15 15 ...
# $ height: int 73 70 74 79 66 69 66 79 75 65 ...
# We add 1/2 to truncated data, so we do not have to add 1/2 to the average values
da$chest = da$chest+1/2; da$weight = da$weight+1/2; da$height = da$height+1/2
H = da$height; min(H); max(H)
# 47.5 96.5
m=mean(H); s=Sd(H)
z = function(x) dnorm(x, mean=m, sd=s)
BF=3;HF=2.1
graph2F(z, 47,97, "brown")
hist(H,n=20,right=FALSE,probability=TRUE,col="grey",add=TRUE)
graph2(z,47,97, "brown"); abovex("data")
POINT(m+s,z(m+s),"blue"); POINT(m-s,z(m-s),"blue")
# The data fit in the graph: see below on the left.
# I can simulate the phenomenon with rnorm(n=N, mean=m, sd=s) that generates N random
# data with normal distribution; obviously also the simulation fit (graph on the right):
#
H1 = rnorm(n=4000, mean=m, sd=s)
graph2F(z, 47,97, "brown")
hist(H1,n=20,right=FALSE,probability=TRUE,col="grey",add=TRUE)
graph2(z,47,97, "brown"); abovex("random")
POINT(m+s,z(m+s),"blue"); POINT(m-s,z(m-s),"blue")
# (σ is the Greek letter "sigma", which corresponds to our "s")
# In R the normal density of mean m and standard deviation s is called
# dnorm(x, mean=m, sd=s). How to obtain the graph above on the right:
z = function(x) dnorm(x, mean=m, sd=s)
x=0:N; y=binom(0:N); Plane(0,N, 0,max(y))
POINT(x,y, "blue")
graph2(z, -20,20, "brown")
# Among the few examples of gaussian phenomenon (in addition to those of the distribu-
# tion of seed lengths already considered - see here), there is the height of the people
# of a particular sex, age, place of origin. Let's use the data already considered here
# (medical examination for a call-up - Italy, 1987):
da = read.table("http://macosa.dima.unige.it/R/callup.txt",skip=8, sep=";",header=TRUE)
str(da)
# 'data.frame': 4170 obs. of 4 variables:
# $ chest : int 91 86 89 88 92 95 91 83 87 88 ...
# $ weight: int 62 64 64 68 70 77 65 62 55 60 ...
# $ region: int 15 15 15 15 15 15 15 15 15 15 ...
# $ height: int 73 70 74 79 66 69 66 79 75 65 ...
# We add 1/2 to truncated data, so we do not have to add 1/2 to the average values
da$chest = da$chest+1/2; da$weight = da$weight+1/2; da$height = da$height+1/2
H = da$height; min(H); max(H)
# 47.5 96.5
m=mean(H); s=Sd(H)
z = function(x) dnorm(x, mean=m, sd=s)
BF=3;HF=2.1
graph2F(z, 47,97, "brown")
hist(H,n=20,right=FALSE,probability=TRUE,col="grey",add=TRUE)
graph2(z,47,97, "brown"); abovex("data")
POINT(m+s,z(m+s),"blue"); POINT(m-s,z(m-s),"blue")
# The data fit in the graph: see below on the left.
# I can simulate the phenomenon with rnorm(n=N, mean=m, sd=s) that generates N random
# data with normal distribution; obviously also the simulation fit (graph on the right):
#
H1 = rnorm(n=4000, mean=m, sd=s)
graph2F(z, 47,97, "brown")
hist(H1,n=20,right=FALSE,probability=TRUE,col="grey",add=TRUE)
graph2(z,47,97, "brown"); abovex("random")
POINT(m+s,z(m+s),"blue"); POINT(m-s,z(m-s),"blue")
 # We pointed out (in blue) in the graphs also m ± σ. One can prove that these points
# are flex points. In general, whatever the gaussian, we have:
integral(z, m-s,m+s) # 0.6826895
integral(z, m-s*2,m+s*2) # 0.9544997
integral(z, m-s*3,m+s*3) # 0.9973002
# and obviously:
integral(z, -Inf,Inf) # 1
# For which s the integral is 0.99?
m=0; s=1; F=function(x) integral(z, -x,x); solution(F,0.99, 0,100) # 2.575829
# The variable "height" is virtually continuous: unlike the number of coins or biscuits
# which only assumed integer values, I can think that a length is a real number.
# Increasing the number of intervals the upper edge of the histogram tends to a curve;
# instead of the sum of the areas of the columns of a histogram between x=a and x=b, I
# have the integral of a function between x=a and x=b.
# In the discrete case I represent the frequency density (ie the unitary percentage
# frequency), in the continuous one I represent the density function.
---------- ---------- ---------- ----------
# We note that x1k, x2k, x3k, … (if k ≠ 1) have a different kind of distribution of x1,
# x2, x3, … An example: x with gaussian distribution and x^3.
x <- rnorm(n=10000,mean=5,sd=1); x3=x^3
Plane(min(x),max(x),0,max(hist(x,plot=FALSE)$density))
hist(x,col="grey",probability=TRUE,add=TRUE)
statistics(x)
# median = 5.005 mean = 5.002
Plane(min(x3),max(x3),0,max(hist(x3,plot=FALSE)$density))
hist(x3,col="grey",probability=TRUE,add=TRUE)
statistics(x3)
# median = 125.400 mean = 140.200
x
# We pointed out (in blue) in the graphs also m ± σ. One can prove that these points
# are flex points. In general, whatever the gaussian, we have:
integral(z, m-s,m+s) # 0.6826895
integral(z, m-s*2,m+s*2) # 0.9544997
integral(z, m-s*3,m+s*3) # 0.9973002
# and obviously:
integral(z, -Inf,Inf) # 1
# For which s the integral is 0.99?
m=0; s=1; F=function(x) integral(z, -x,x); solution(F,0.99, 0,100) # 2.575829
# The variable "height" is virtually continuous: unlike the number of coins or biscuits
# which only assumed integer values, I can think that a length is a real number.
# Increasing the number of intervals the upper edge of the histogram tends to a curve;
# instead of the sum of the areas of the columns of a histogram between x=a and x=b, I
# have the integral of a function between x=a and x=b.
# In the discrete case I represent the frequency density (ie the unitary percentage
# frequency), in the continuous one I represent the density function.
---------- ---------- ---------- ----------
# We note that x1k, x2k, x3k, … (if k ≠ 1) have a different kind of distribution of x1,
# x2, x3, … An example: x with gaussian distribution and x^3.
x <- rnorm(n=10000,mean=5,sd=1); x3=x^3
Plane(min(x),max(x),0,max(hist(x,plot=FALSE)$density))
hist(x,col="grey",probability=TRUE,add=TRUE)
statistics(x)
# median = 5.005 mean = 5.002
Plane(min(x3),max(x3),0,max(hist(x3,plot=FALSE)$density))
hist(x3,col="grey",probability=TRUE,add=TRUE)
statistics(x3)
# median = 125.400 mean = 140.200
x  x^3
# x -> x^3 is a growing function; so the median of x^3 is the cube of the median of x;
# this does not happen for the mean!
---------- ---------- ---------- ----------
# Generalizing what we just saw (here), we have:
# if I sum up N random variables that have the same distribution, I obtain a random
# variable that (as N -> ∞) tends toward a gaussian distribution. An example:
tot = 2000; x = NULL # N = 1
for (i in 1:tot) x[i] = sqrt(runif(1))+3*runif(1)^2
dev.new(); hist(x, probability=TRUE, col="grey",main="",cex.axis=0.9)
BOX(); abovex("n=1")
# N = 20
for (i in 1:tot) {x[i]=0; for (j in 1:20) x[i]=x[i]+sqrt(runif(1))+3*runif(1)^2}
dev.new(); hist(x, probability=TRUE, col="grey",main="",cex.axis=0.9)
BOX(); abovex("n=20")
x^3
# x -> x^3 is a growing function; so the median of x^3 is the cube of the median of x;
# this does not happen for the mean!
---------- ---------- ---------- ----------
# Generalizing what we just saw (here), we have:
# if I sum up N random variables that have the same distribution, I obtain a random
# variable that (as N -> ∞) tends toward a gaussian distribution. An example:
tot = 2000; x = NULL # N = 1
for (i in 1:tot) x[i] = sqrt(runif(1))+3*runif(1)^2
dev.new(); hist(x, probability=TRUE, col="grey",main="",cex.axis=0.9)
BOX(); abovex("n=1")
# N = 20
for (i in 1:tot) {x[i]=0; for (j in 1:20) x[i]=x[i]+sqrt(runif(1))+3*runif(1)^2}
dev.new(); hist(x, probability=TRUE, col="grey",main="",cex.axis=0.9)
BOX(); abovex("n=20")
 # That's the reason why the gaussian distribution is important: there are a few
# gaussian phenomena, but if I calculate the mean of N values with the same
# distribution (ie if I calculate their sum divided for N), this mean has a gaussian
# distribution. This fact goes under the name of central limit theorem:
# If U1,…,Un are random indipendent variables with the same law of distribution, and if
# m and σ0 are its mean and standard deviation, when n grows the variable (U1+ … +Un)/n
# tends to have a normal distribution with mean m and standard deviation σ0/√n.
# Let's consider as an example of non-Gaussian distribution the weights of the
# population of twenty years considered above.
da = read.table("http://macosa.dima.unige.it/R/callup.txt",skip=8, sep=";",header=TRUE)
da$chest = da$chest+1/2; da$weight <- da$weight+1/2; da$height <- da$height+1/2
W = da$weight; min(W); max(W)
# 48.5 126.5
BF=3.5; HF=2.5
max(hist(W, probability=TRUE, col="grey",main="",cex.axis=0.9)$density)
# 0.03856115
Plane(48,127,0,0.04)
hist(W, probability=TRUE, col="grey",cex.axis=0.9,add=TRUE)
abovex("weight - call-up - Italy, 1987"); POINT(mean(W),0,"blue")
# That's the reason why the gaussian distribution is important: there are a few
# gaussian phenomena, but if I calculate the mean of N values with the same
# distribution (ie if I calculate their sum divided for N), this mean has a gaussian
# distribution. This fact goes under the name of central limit theorem:
# If U1,…,Un are random indipendent variables with the same law of distribution, and if
# m and σ0 are its mean and standard deviation, when n grows the variable (U1+ … +Un)/n
# tends to have a normal distribution with mean m and standard deviation σ0/√n.
# Let's consider as an example of non-Gaussian distribution the weights of the
# population of twenty years considered above.
da = read.table("http://macosa.dima.unige.it/R/callup.txt",skip=8, sep=";",header=TRUE)
da$chest = da$chest+1/2; da$weight <- da$weight+1/2; da$height <- da$height+1/2
W = da$weight; min(W); max(W)
# 48.5 126.5
BF=3.5; HF=2.5
max(hist(W, probability=TRUE, col="grey",main="",cex.axis=0.9)$density)
# 0.03856115
Plane(48,127,0,0.04)
hist(W, probability=TRUE, col="grey",cex.axis=0.9,add=TRUE)
abovex("weight - call-up - Italy, 1987"); POINT(mean(W),0,"blue")
 length(W); Sd(W)/sqrt(length(W))
# 4170 0.1630721
E=3*Sd(W)/sqrt(length(W)); mean(W)-E; mean(W)+E
# 70.48752 71.46595
# The mean weight of the twenty years italian men was 71 ± 0.5 kg
# But the mean and the standard deviation that we considered are not the mean and the
# standard deviation of the population of all the twenty years italian men (in 1987),
# they are those of the sample. It can be proved that, while the statistical mean is a
# good approximation of the theoretical one, I have to consider (insted of the
# theoretic standard deviation, Sd) the experimental standard deviation sd, where n is
# replaced by n-1:
# Sd is √( ( (X1-M)^2 + … + (Xn-M)^2 ) / n )
# sd is √( ( (X1-M)^2 + … + (Xn-M)^2 ) / (n-1) ) [ > Sd]
# So, (U1+ … +Un)/n tends to have a normal distribution which have the experimental
# mean as a mean and sd/√n as a standard deviation. I can calculare this value with
# SdM (standard deviation of the mean). See here
# When n is large the difference between the two values is negligible:
Sd(W)/sqrt(4170); sd(W)/sqrt(4170); SdM(W)
# 0.1630721 0.1630916 0.1630916
# It is due to the replacement of √n with √(n-1):
n=4170; sqrt(n/(n-1)); n=20; sqrt(n/(n-1)); n=10; sqrt(n/(n-1))
# 1.00012 1.025978 1.054093
# Therefore, more correct calculations in our case would be:
E=3*SdM(W); mean(W)-E; mean(W)+E
# 70.48746 71.46601
# To be precise we should say: there is the probability of confidence of 99.73% that
# [70.48746,71.46601] contains the exact value. If we use E=2*SdM(W) we should say
# the probability of confidence is 95.45%. The interval is called a confidence interval.
---------- ---------- ---------- ----------
# In the discrete case the probability that U is between a and b is Pr(U=a)+…+Pr(U=b);
# in the continuous case the probability that the density function U is between a and b
# (where a and b may be infinite) is ∫[a,b] U(x) dx. In the discrete case if U has values
# in {v1,v2,…} the mean is v1·Pr(U=v1) + v2·Pr(U=v2) + …; in the continuous case if U
# varies in I it is ∫I x·U(x) dx; so, if m is the mean, the variance is ∫I (x-m)²·U(x) dx
# If I sum up only two random variables uniformly distributed on [0,1] I have (just
# like we saw here for the launch of two balanced dice):
HF=2; BF=4
PLANE(0,2, 0,1)
n = 1e6; U1 = runif(n,0,1); U2 = runif(n,0,1)
hist(U1+U2, probability=TRUE, col="grey90", add=TRUE, nclass=40) # or: n=40
# the density function (from x=0 to x=2) is:
f = function(x) -abs(x-1)+1
graph1(f, 0,2, "blue"); abovex("runif+runif")
# and (as it should be) I have:
integral(f, 0,2)
# 1
# and the mean:
g = function(x) x*f(x); integral(g, 0,2)
# 1
# The graph of the probability that U1+U2 is less than x (see here):
Gintegra(f,0,2,"black")
length(W); Sd(W)/sqrt(length(W))
# 4170 0.1630721
E=3*Sd(W)/sqrt(length(W)); mean(W)-E; mean(W)+E
# 70.48752 71.46595
# The mean weight of the twenty years italian men was 71 ± 0.5 kg
# But the mean and the standard deviation that we considered are not the mean and the
# standard deviation of the population of all the twenty years italian men (in 1987),
# they are those of the sample. It can be proved that, while the statistical mean is a
# good approximation of the theoretical one, I have to consider (insted of the
# theoretic standard deviation, Sd) the experimental standard deviation sd, where n is
# replaced by n-1:
# Sd is √( ( (X1-M)^2 + … + (Xn-M)^2 ) / n )
# sd is √( ( (X1-M)^2 + … + (Xn-M)^2 ) / (n-1) ) [ > Sd]
# So, (U1+ … +Un)/n tends to have a normal distribution which have the experimental
# mean as a mean and sd/√n as a standard deviation. I can calculare this value with
# SdM (standard deviation of the mean). See here
# When n is large the difference between the two values is negligible:
Sd(W)/sqrt(4170); sd(W)/sqrt(4170); SdM(W)
# 0.1630721 0.1630916 0.1630916
# It is due to the replacement of √n with √(n-1):
n=4170; sqrt(n/(n-1)); n=20; sqrt(n/(n-1)); n=10; sqrt(n/(n-1))
# 1.00012 1.025978 1.054093
# Therefore, more correct calculations in our case would be:
E=3*SdM(W); mean(W)-E; mean(W)+E
# 70.48746 71.46601
# To be precise we should say: there is the probability of confidence of 99.73% that
# [70.48746,71.46601] contains the exact value. If we use E=2*SdM(W) we should say
# the probability of confidence is 95.45%. The interval is called a confidence interval.
---------- ---------- ---------- ----------
# In the discrete case the probability that U is between a and b is Pr(U=a)+…+Pr(U=b);
# in the continuous case the probability that the density function U is between a and b
# (where a and b may be infinite) is ∫[a,b] U(x) dx. In the discrete case if U has values
# in {v1,v2,…} the mean is v1·Pr(U=v1) + v2·Pr(U=v2) + …; in the continuous case if U
# varies in I it is ∫I x·U(x) dx; so, if m is the mean, the variance is ∫I (x-m)²·U(x) dx
# If I sum up only two random variables uniformly distributed on [0,1] I have (just
# like we saw here for the launch of two balanced dice):
HF=2; BF=4
PLANE(0,2, 0,1)
n = 1e6; U1 = runif(n,0,1); U2 = runif(n,0,1)
hist(U1+U2, probability=TRUE, col="grey90", add=TRUE, nclass=40) # or: n=40
# the density function (from x=0 to x=2) is:
f = function(x) -abs(x-1)+1
graph1(f, 0,2, "blue"); abovex("runif+runif")
# and (as it should be) I have:
integral(f, 0,2)
# 1
# and the mean:
g = function(x) x*f(x); integral(g, 0,2)
# 1
# The graph of the probability that U1+U2 is less than x (see here):
Gintegra(f,0,2,"black")
 # This function (the function with black graph) is the cumulative distribution function
# of U1+U2.
# In the case of the gaussian distribution I have:
z = function(x) dnorm(x, mean=0, sd=1)
HF=2; BF=3
graphF(z, -4,4, "blue")
# On the right the graph of the cumulative distribution function:
Plane(-4,4, 0,1)
Gintegra(z,-10,10, "brown")
# I should have drawn the graph of ∫(-∞,x] z, but
# in Gintegra(f,A,B,col) I must use A and B finite. However ∫(-10,x] z is practically the
# same; indeed:
integral(z, -Inf,-10)
# 7.619853e-24
# This function (the function with black graph) is the cumulative distribution function
# of U1+U2.
# In the case of the gaussian distribution I have:
z = function(x) dnorm(x, mean=0, sd=1)
HF=2; BF=3
graphF(z, -4,4, "blue")
# On the right the graph of the cumulative distribution function:
Plane(-4,4, 0,1)
Gintegra(z,-10,10, "brown")
# I should have drawn the graph of ∫(-∞,x] z, but
# in Gintegra(f,A,B,col) I must use A and B finite. However ∫(-10,x] z is practically the
# same; indeed:
integral(z, -Inf,-10)
# 7.619853e-24
 ---------- ---------- ---------- ----------
# The examples of simulation considered here employ a procedure that is based on
# central limit theorem and the methods for studying the binomial distribution
# considered at the beginning of this document, but merely compute the mean and the
# standard deviation [ in this case N=1 and Var=p*(1-p) ]
# Let's remember the first example:
# the probability that throwing a pair of balanced dice their difference is 1
# (we - really - know it is 5/18 = 0.2777…)
Event <- function() abs( RUNIF(1, 1,6)-RUNIF(1, 1,6) ) == 1
PR(1e4)
# 27.9 +/- 1.34559
PR(1e5)
# 27.737 +/- 0.4247283
PR(1e6)
# 27.8421 +/- 0.1344666
# As n -> ∞ the standard deviation σ/√n -> 0 as 1/√n: the "error" of PR(N) is divided
# by 10 if N multiplies by 100.
# It is basically for this reason that (while analyzing statistical data) if the number
# of data is multiplied by 100 I can round the average with a further figure.
# If I have at least 10 data which are rounded to the thents I can round the mean to
# the cents. If I have at least 1000 data which are rounded to the thents I can round
# the mean to the thousandths. If I have at least 10 data which are rounded to the
# units I can round the mean to the tens (see). Verification:
# Some data rounded to the units:
data=runif(11, 50,100); c( mean(data), mean(round(data)) )
# 77.32430 77.27273
data=runif(101, 50,100); c( mean(data), mean(round(data)) )
# 75.86425 75.83168
data=runif(1001, 50,100); c( mean(data), mean(round(data)) )
# 74.99541 74.99800
data=runif(10001, 50,100); c( mean(data), mean(round(data)) )
# 75.18941 75.18628
data=runif(100001, 50,100); c( mean(data), mean(round(data)) )
# 74.94769 74.94847
# Data must be rounded!!! See here. See here too.
Other distributions
Other examples of use
---------- ---------- ---------- ----------
# The examples of simulation considered here employ a procedure that is based on
# central limit theorem and the methods for studying the binomial distribution
# considered at the beginning of this document, but merely compute the mean and the
# standard deviation [ in this case N=1 and Var=p*(1-p) ]
# Let's remember the first example:
# the probability that throwing a pair of balanced dice their difference is 1
# (we - really - know it is 5/18 = 0.2777…)
Event <- function() abs( RUNIF(1, 1,6)-RUNIF(1, 1,6) ) == 1
PR(1e4)
# 27.9 +/- 1.34559
PR(1e5)
# 27.737 +/- 0.4247283
PR(1e6)
# 27.8421 +/- 0.1344666
# As n -> ∞ the standard deviation σ/√n -> 0 as 1/√n: the "error" of PR(N) is divided
# by 10 if N multiplies by 100.
# It is basically for this reason that (while analyzing statistical data) if the number
# of data is multiplied by 100 I can round the average with a further figure.
# If I have at least 10 data which are rounded to the thents I can round the mean to
# the cents. If I have at least 1000 data which are rounded to the thents I can round
# the mean to the thousandths. If I have at least 10 data which are rounded to the
# units I can round the mean to the tens (see). Verification:
# Some data rounded to the units:
data=runif(11, 50,100); c( mean(data), mean(round(data)) )
# 77.32430 77.27273
data=runif(101, 50,100); c( mean(data), mean(round(data)) )
# 75.86425 75.83168
data=runif(1001, 50,100); c( mean(data), mean(round(data)) )
# 74.99541 74.99800
data=runif(10001, 50,100); c( mean(data), mean(round(data)) )
# 75.18941 75.18628
data=runif(100001, 50,100); c( mean(data), mean(round(data)) )
# 74.94769 74.94847
# Data must be rounded!!! See here. See here too.
Other distributions
Other examples of use