---------- ---------- ---------- ---------- ---------- ---------- ---------- ----------
# P() lets you click a point and read its coordinates. This is useful in all cases
# where you have to deal with graphics and images. It can also be useful for drawing
# figures; for example:
HF=3; BF=3; PLANE(0,10, 0,10)
P() # I click more or less at point 5,9 and get:
# xP <- ... ; yP <- ...
# Then I reproduce each of the following lines and click more or less in 2,2 8,2 5,9
x <- xP; y <- yP; P(); segm(xP,yP, x,y, "red")
# xP <- ... ; yP <- ... I do things like this after the next two lines
x <- xP; y <- yP; P(); segm((xP,yP, x,y, "red")
x <- xP; y <- yP; P(); segm((xP,yP, x,y, "red")
# I get the red triangle on the left:
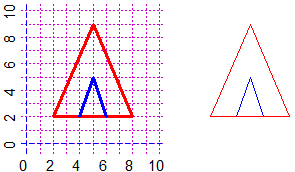 # Similarly, sketch the blue figure:
P()
x <- xP; y <- yP; P(); segm(xP,yP, x,y, "blue")
x <- xP; y <- yP; P(); segm(xP,yP, x,y, "blue")
# Then if I want to reproduce the figure without scale, I can use the x,y values printed
# out, getting the figure to the right (if I use "broken" I would have thicker lines)
PLANEww(0,10, 0,10)
x <- c(2,8,5,2); y <- c(2,2,9,2); polyl(x,y, "red")
x <- c(6,5,4); y <- c(2,5,2); polyl(x,y, "blue")
# Similarly, sketch the blue figure:
P()
x <- xP; y <- yP; P(); segm(xP,yP, x,y, "blue")
x <- xP; y <- yP; P(); segm(xP,yP, x,y, "blue")
# Then if I want to reproduce the figure without scale, I can use the x,y values printed
# out, getting the figure to the right (if I use "broken" I would have thicker lines)
PLANEww(0,10, 0,10)
x <- c(2,8,5,2); y <- c(2,2,9,2); polyl(x,y, "red")
x <- c(6,5,4); y <- c(2,5,2); polyl(x,y, "blue")