source("http://macosa.dima.unige.it/r.R") # If I have not already loaded the library
---------- ---------- ---------- ---------- ---------- ---------- ---------- ----------
[ continuation from here ]
# We've seen how to copy and then paste the "peninsula" file into R. Let's see how we
# could proceed if we had directly loaded the data from a text file with this content:
# penisola italiana
8,46
7.87,45.9
7.6,45.95
...
8,46
# Let's see how you can examine the content of a file. With
readLines("http://macosa.dima.unige.it/R/penisola.txt",n=4)
# I command the display of the first 4 rows of the file "penisola.txt". I get:
# "# penisola italiana" "8,46" "7.87,45.9" "7.6,45.95"
# I understand that the file is a table of pairs of data with a comment in front;
# only the first and second elements of each pair are separated by ",".
# I put the table in a file (let's call it "T") using the following command, in which
# I specify that I must jump (skip) a line (the comment) and that the data is
# separated by ",":
T = read.table("http://macosa.dima.unige.it/R/penisola.txt",skip=1,sep=",")
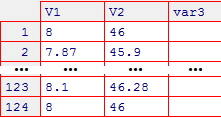
# I did not print the table so as not to occupy space; I display it with:
data.entry(T) # The following window appears (then I close it):
 # If I read a file where the numbers are not in English notation I can use the option
# dec. An example:
readLines("http://macosa.dima.unige.it/R/penisola2.txt",n=4)
# "# penisola italiana (with comma instead of point to separate integer and decimal
# parts)" "8;46" "7,87;45,9" "7,6;45,95"
TB = read.table("http://macosa.dima.unige.it/R/penisola2.txt",skip=1,sep=";",dec=",")
data.entry(TB)
# I obtain the same windows (with the numbers transformed into English notation)
# The two data columns are called V1 and V2. I put them in X and Y with:
X = T$V1; Y = T$V2 # If I want, I look at data with data.entry(X) and …(Y)
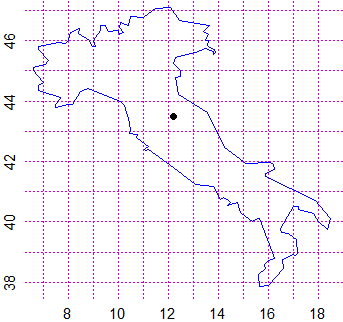
# I proceed as above:
HF=4; BF=4
Plane(min(X),max(X), min(Y),max(Y)); polyl(X,Y, "blue")
C = centerPol(X,Y); PUNTO(C[1],C[2], "black")
# If I read a file where the numbers are not in English notation I can use the option
# dec. An example:
readLines("http://macosa.dima.unige.it/R/penisola2.txt",n=4)
# "# penisola italiana (with comma instead of point to separate integer and decimal
# parts)" "8;46" "7,87;45,9" "7,6;45,95"
TB = read.table("http://macosa.dima.unige.it/R/penisola2.txt",skip=1,sep=";",dec=",")
data.entry(TB)
# I obtain the same windows (with the numbers transformed into English notation)
# The two data columns are called V1 and V2. I put them in X and Y with:
X = T$V1; Y = T$V2 # If I want, I look at data with data.entry(X) and …(Y)
# I proceed as above:
HF=4; BF=4
Plane(min(X),max(X), min(Y),max(Y)); polyl(X,Y, "blue")
C = centerPol(X,Y); PUNTO(C[1],C[2], "black")
 # If I want add the isles (see above on the right):
T1 = read.table("http://macosa.dima.unige.it/R/sicilia.txt",skip=1,sep=",")
T2 = read.table("http://macosa.dima.unige.it/R/sardegna.txt",skip=1,sep=",")
X1 = T1$V1; Y1 = T1$V2; X2 = T2$V1; Y2 = T2$V2
Plane(min(X),max(X), min(Y,Y1,Y2),max(Y))
polyl(X,Y, "blue"); polyl(X1,Y1, "brown"); polyl(X2,Y2, "brown")
#
# These examples have been made for introducing some commands.
# The coordinates of Italy are already stored in the following variables:
# Italy1, Italy2, Italy3:
X1 = xTab(Italy1); Y1 = yTab(Italy1) # peninsula
X2 = xTab(Italy2); Y2 = yTab(Italy2) # Sicilia
X3 = xTab(Italy3); Y3 = yTab(Italy3) # Sardegna
min(c(X1,X2,X3)); max(c(X1,X2,X3))
# 6.6 18.5
min(c(Y1,Y2,Y3)); max(c(Y1,Y2,Y3))
# 36.66 47.1
BF=5; HF=5
Plane(6,19, 36,48)
polyl(X1,Y1,"brown"); polyl(X2,Y2,"brown"); polyl(X3,Y3,"brown")
# If I want add the isles (see above on the right):
T1 = read.table("http://macosa.dima.unige.it/R/sicilia.txt",skip=1,sep=",")
T2 = read.table("http://macosa.dima.unige.it/R/sardegna.txt",skip=1,sep=",")
X1 = T1$V1; Y1 = T1$V2; X2 = T2$V1; Y2 = T2$V2
Plane(min(X),max(X), min(Y,Y1,Y2),max(Y))
polyl(X,Y, "blue"); polyl(X1,Y1, "brown"); polyl(X2,Y2, "brown")
#
# These examples have been made for introducing some commands.
# The coordinates of Italy are already stored in the following variables:
# Italy1, Italy2, Italy3:
X1 = xTab(Italy1); Y1 = yTab(Italy1) # peninsula
X2 = xTab(Italy2); Y2 = yTab(Italy2) # Sicilia
X3 = xTab(Italy3); Y3 = yTab(Italy3) # Sardegna
min(c(X1,X2,X3)); max(c(X1,X2,X3))
# 6.6 18.5
min(c(Y1,Y2,Y3)); max(c(Y1,Y2,Y3))
# 36.66 47.1
BF=5; HF=5
Plane(6,19, 36,48)
polyl(X1,Y1,"brown"); polyl(X2,Y2,"brown"); polyl(X3,Y3,"brown")