---------- ---------- ---------- ---------- ---------- ---------- ---------- ----------
# (this document use commands from "C. Other examples of use", here and here)
# We have seen how to print a table of data:
# 1, 2, 3, 4, 5, 6, 7, 8
# 9, 0, 1, 2, 3, 4, 5, 6
# 7, 8, 9, 0, 1, 2, 3, 4
# Now we see how to build figures that contain tables like the following:
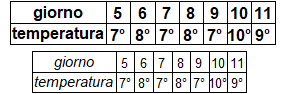 # How to build the first table:
BF=6; HF=2
F1=2; F2=2; D1=1; D2=1
A1=4; A2=1; N=7 # width of 1^ cell and of the others, their quantity
boxW(0,A1+A2*N,0,10) # a window without margins
polyC(c(0,A1+A2*N),c(5,5),0) # horizontal separation line
polyC(c(0,A1+A2*N,A1+A2*N,0),c(0,0,10,10),0) # the box
for(i in 0:N) polyC(c(A1+A2*i,A1+A2*i),c(0,10),0) # vertical separation line
text(A1/2,7.5,"giorno",font=F1,cex=D1)
text(A1/2,2.5,"temperatura",font=F1,cex=D1)
#
text(A1+A2*0+1/2,7.5,"5",font=F2,cex=D2)
text(A1+A2*1+1/2,7.5,"6",font=F2,cex=D2)
text(A1+A2*2+1/2,7.5,"7",font=F2,cex=D2)
text(A1+A2*3+1/2,7.5,"8",font=F2,cex=D2)
text(A1+A2*4+1/2,7.5,"9",font=F2,cex=D2)
text(A1+A2*5+1/2,7.5,"10",font=F2,cex=D2)
text(A1+A2*6+1/2,7.5,"11",font=F2,cex=D2)
#
text(A1+A2*0+1/2,2.5,"7°",font=F2,cex=D2)
text(A1+A2*1+1/2,2.5,"8°",font=F2,cex=D2)
text(A1+A2*2+1/2,2.5,"7°",font=F2,cex=D2)
text(A1+A2*3+1/2,2.5,"8°",font=F2,cex=D2)
text(A1+A2*4+1/2,2.5,"7°",font=F2,cex=D2)
text(A1+A2*5+1/2,2.5,"10°",font=F2,cex=D2)
text(A1+A2*6+1/2,2.5,"9°",font=F2,cex=D2)
# How to build the first table:
BF=6; HF=2
F1=2; F2=2; D1=1; D2=1
A1=4; A2=1; N=7 # width of 1^ cell and of the others, their quantity
boxW(0,A1+A2*N,0,10) # a window without margins
polyC(c(0,A1+A2*N),c(5,5),0) # horizontal separation line
polyC(c(0,A1+A2*N,A1+A2*N,0),c(0,0,10,10),0) # the box
for(i in 0:N) polyC(c(A1+A2*i,A1+A2*i),c(0,10),0) # vertical separation line
text(A1/2,7.5,"giorno",font=F1,cex=D1)
text(A1/2,2.5,"temperatura",font=F1,cex=D1)
#
text(A1+A2*0+1/2,7.5,"5",font=F2,cex=D2)
text(A1+A2*1+1/2,7.5,"6",font=F2,cex=D2)
text(A1+A2*2+1/2,7.5,"7",font=F2,cex=D2)
text(A1+A2*3+1/2,7.5,"8",font=F2,cex=D2)
text(A1+A2*4+1/2,7.5,"9",font=F2,cex=D2)
text(A1+A2*5+1/2,7.5,"10",font=F2,cex=D2)
text(A1+A2*6+1/2,7.5,"11",font=F2,cex=D2)
#
text(A1+A2*0+1/2,2.5,"7°",font=F2,cex=D2)
text(A1+A2*1+1/2,2.5,"8°",font=F2,cex=D2)
text(A1+A2*2+1/2,2.5,"7°",font=F2,cex=D2)
text(A1+A2*3+1/2,2.5,"8°",font=F2,cex=D2)
text(A1+A2*4+1/2,2.5,"7°",font=F2,cex=D2)
text(A1+A2*5+1/2,2.5,"10°",font=F2,cex=D2)
text(A1+A2*6+1/2,2.5,"9°",font=F2,cex=D2)
 # Now I can resize the figure, saving the image and paste it into the document I want.
 # If I change data or dimensions I have to change the first rows:
F1=3; F2=1; D1=0.9; D2=0.8
A1=4.5; A2=1; N=7
# ...
# I obtain the second table.
# If I change data or dimensions I have to change the first rows:
F1=3; F2=1; D1=0.9; D2=0.8
A1=4.5; A2=1; N=7
# ...
# I obtain the second table.
 #
# See here for the command index.
#
# See here for the command index.