---------- ---------- ---------- ---------- ---------- ---------- ---------- ----------
# PQ(A,B)               that tracks (in blue) the segment joining A to B
# Ptext(A,f)               that writes in bold the sentence f in point A
# PQtext(A,B,f)     that writes the sentence f in the middle point of AB
#
BF=7.5; HF=5                  # I can change the size of the window
boxW(-70,70, -70,70)          # I should leave this scale
BOX()                         # I put it to see the grid; then I take it off
A = c(0,60); B = c(-30,40); C = c(30,40)
PQ(A,B); PQ(A,C); D = c(-45,20); E = c(-15,20)
PQ(B,D); PQ(B,E); F = c(-30,0); G = c(0,0)
PQ(E,F); PQ(E,G)
 |
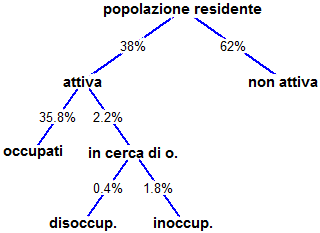
A, B, ..., G are the variables
with which I called the points that
are the "nodes" of the graph. Of
course I could choose other names.
|
Ptext(A,"popolazione residente"); Ptext(B,"attiva")
Ptext(C,"non attiva"); Ptext(D,"occupati")
Ptext(E,"in cerca di o."); Ptext(F,"disoccup.")
Ptext(G,"inoccup."); PQtext(A,B,"38%"); PQtext(A,C,"62%")
PQtext(B,D,"35.8%"); PQtext(B,E,"2.2%"); PQtext(E,F,"0.4%")
PQtext(E,G,"1.8%%")
 #
#
BF=7.5; HF=5
boxW(-70,70, -70,70)
A = c(0,60); B = c(-30,40); C = c(30,40)
PQ(A,B); PQ(A,C); D = c(-45,20); E = c(-15,20)
PQ(B,D); PQ(B,E); F = c(-30,0); G = c(0,0)
PQ(E,F); PQ(E,G)
Ptext(A,"popolazione residente"); Ptext(B,"attiva")
Ptext(C,"non attiva"); Ptext(D,"occupati")
Ptext(E,"in cerca di o."); Ptext(F,"disoccup.")
Ptext(G,"inoccup."); PQtext(A,B,"38%"); PQtext(A,C,"62%")
PQtext(B,D,"35.8%"); PQtext(B,E,"2.2%"); PQtext(E,F,"0.4%")
PQtext(E,G,"1.8%")
#
#
BF=7.5; HF=5
boxW(-70,70, -70,70)
A = c(0,60); B = c(-30,40); C = c(30,40)
PQ(A,B); PQ(A,C); D = c(-45,20); E = c(-15,20)
PQ(B,D); PQ(B,E); F = c(-30,0); G = c(0,0)
PQ(E,F); PQ(E,G)
Ptext(A,"popolazione residente"); Ptext(B,"attiva")
Ptext(C,"non attiva"); Ptext(D,"occupati")
Ptext(E,"in cerca di o."); Ptext(F,"disoccup.")
Ptext(G,"inoccup."); PQtext(A,B,"38%"); PQtext(A,C,"62%")
PQtext(B,D,"35.8%"); PQtext(B,E,"2.2%"); PQtext(E,F,"0.4%")
PQtext(E,G,"1.8%")
 #
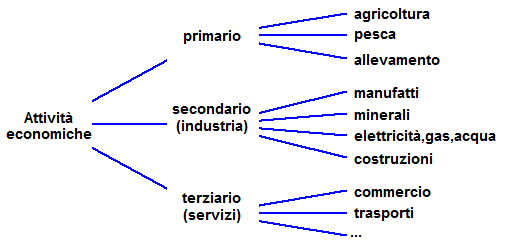
# In some cases, like the following, it may be convenient to create "horizontally"
# the graphs
#
# In some cases, like the following, it may be convenient to create "horizontally"
# the graphs
 # To make graphs like this I can also use the following commands:
# Ptext2(A,f) that writes in bold the phrase f to the right of point A
# CLEAN(a,b, c,d) that clears the rectangle that has [a,b] and [c,d]
# as horizontal side and vertical side
#
BF=6; HF=3.5 # I can change the dimensions
boxW(-70,70, -70,70) # This is the convenient scale
BOX() # I use BOX() to see the grid; then I repeat without BOX()
x1=-53; x2=-10; x3=25
A=c(x1,0); B=c(x2,40); C=c(x2,0); D=c(x2,-40); PQ(A,B); PQ(A,C); PQ(A,D)
E = c(x3,50); F=c(x3,40); G=c(x3,30); PQ(B,E); PQ(B,F); PQ(B,G)
H = c(x3,15); K=c(x3,5); L=c(x3,-5); M=c(x3,-15); PQ(C,H); PQ(C,K); PQ(C,L); PQ(C,M)
N = c(x3,-30); O=c(x3,-40); P=c(x3,-50); PQ(D,N); PQ(D,O); PQ(D,P)
#
CLEAN(-80,x1+11, -80,80)
Ptext(A,"Attivitą\neconomiche")
CLEAN(x2-12,x2+12, -80,80)
Ptext(B,"primario")
Ptext(C,"secondario\n(industria)\n")
Ptext(D,"terziario\n(servizi)\n")
Ptext2(E," agricoltura"); Ptext2(F," pesca"); Ptext2(G," allevamento")
Ptext2(H," manufatti"); Ptext2(K," minerali"); Ptext2(L," elettricitą,gas,acqua")
Ptext2(M," costruzioni"); Ptext2(N," commercio"); Ptext2(O," trasporti"); Ptext2(P," ...")
# To make graphs like this I can also use the following commands:
# Ptext2(A,f) that writes in bold the phrase f to the right of point A
# CLEAN(a,b, c,d) that clears the rectangle that has [a,b] and [c,d]
# as horizontal side and vertical side
#
BF=6; HF=3.5 # I can change the dimensions
boxW(-70,70, -70,70) # This is the convenient scale
BOX() # I use BOX() to see the grid; then I repeat without BOX()
x1=-53; x2=-10; x3=25
A=c(x1,0); B=c(x2,40); C=c(x2,0); D=c(x2,-40); PQ(A,B); PQ(A,C); PQ(A,D)
E = c(x3,50); F=c(x3,40); G=c(x3,30); PQ(B,E); PQ(B,F); PQ(B,G)
H = c(x3,15); K=c(x3,5); L=c(x3,-5); M=c(x3,-15); PQ(C,H); PQ(C,K); PQ(C,L); PQ(C,M)
N = c(x3,-30); O=c(x3,-40); P=c(x3,-50); PQ(D,N); PQ(D,O); PQ(D,P)
#
CLEAN(-80,x1+11, -80,80)
Ptext(A,"Attivitą\neconomiche")
CLEAN(x2-12,x2+12, -80,80)
Ptext(B,"primario")
Ptext(C,"secondario\n(industria)\n")
Ptext(D,"terziario\n(servizi)\n")
Ptext2(E," agricoltura"); Ptext2(F," pesca"); Ptext2(G," allevamento")
Ptext2(H," manufatti"); Ptext2(K," minerali"); Ptext2(L," elettricitą,gas,acqua")
Ptext2(M," costruzioni"); Ptext2(N," commercio"); Ptext2(O," trasporti"); Ptext2(P," ...")
 #
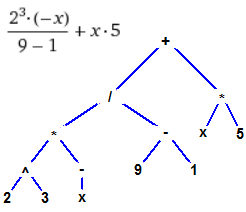
# Another example. The tree graph of a term:
#
# Another example. The tree graph of a term:
 boxW(-70,70, -70,70)
# BOX()
A = c(20,60); B = c(-10,30); C = c(50,30)
PQ(A,B); PQ(A,C)
D = c(-40,10); E = c(20,10); F = c(40,10); G = c(60,10)
PQ(B,D); PQ(B,E); PQ(C,F); PQ(C,G)
H = c(-55,-10); I = c(-25,-10); J = c(5,-10); K = c(35,-10)
PQ(D,H); PQ(D,I); PQ(E,J); PQ(E,K)
L = c(-65,-25); M = c(-45,-25); N = c(-25,-25)
PQ(H,L); PQ(H,M); PQ(I,N)
Ptext(A,"+"); Ptext(B,"/"); Ptext(C,"*")
Ptext(D,"*"); Ptext(E,"-"); Ptext(F,"x"); Ptext(G,"5")
Ptext(H,"^"); Ptext(I,"-"); Ptext(J,"9"); Ptext(K,"1")
Ptext(L,"2"); Ptext(M,"3"); Ptext(N,"x")
boxW(-70,70, -70,70)
# BOX()
A = c(20,60); B = c(-10,30); C = c(50,30)
PQ(A,B); PQ(A,C)
D = c(-40,10); E = c(20,10); F = c(40,10); G = c(60,10)
PQ(B,D); PQ(B,E); PQ(C,F); PQ(C,G)
H = c(-55,-10); I = c(-25,-10); J = c(5,-10); K = c(35,-10)
PQ(D,H); PQ(D,I); PQ(E,J); PQ(E,K)
L = c(-65,-25); M = c(-45,-25); N = c(-25,-25)
PQ(H,L); PQ(H,M); PQ(I,N)
Ptext(A,"+"); Ptext(B,"/"); Ptext(C,"*")
Ptext(D,"*"); Ptext(E,"-"); Ptext(F,"x"); Ptext(G,"5")
Ptext(H,"^"); Ptext(I,"-"); Ptext(J,"9"); Ptext(K,"1")
Ptext(L,"2"); Ptext(M,"3"); Ptext(N,"x")
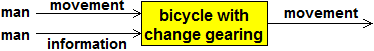
 # ptext and ptext2 do not delete the part under the writing and write the text in
# larger dimensions
BF=6; HF=3.5 # I can change the dimensions
boxW(-70,70, -70,70) # This is the convenient scale
BOX() # I use BOX() to see the grid; then I repeat without BOX()
A=c(0,0); Ptext(A, "bicycle with\nchange gearing")
B=c(-30,7); Ptext(B,"movement")
C=c(-30,-7); Ptext(C,"information")
D=c(-48,4); Ptext(D,"man")
E=c(-48,-4); Ptext(E,"man")
F=c(30,4); Ptext(F,"movement")
x=c(-16,16,16,-16); y=c(-8,-8,8,8); polyC(x,y,"yellow") # [or spezzaC ]
ptext(A, "bicycle with\nchange gearing")
dart(-43,3.5, -16,3.5, 1); dart(-43,-3.5, -16,-3.5, 1)
dart(16,0, 43,0, 1)
# ptext and ptext2 do not delete the part under the writing and write the text in
# larger dimensions
BF=6; HF=3.5 # I can change the dimensions
boxW(-70,70, -70,70) # This is the convenient scale
BOX() # I use BOX() to see the grid; then I repeat without BOX()
A=c(0,0); Ptext(A, "bicycle with\nchange gearing")
B=c(-30,7); Ptext(B,"movement")
C=c(-30,-7); Ptext(C,"information")
D=c(-48,4); Ptext(D,"man")
E=c(-48,-4); Ptext(E,"man")
F=c(30,4); Ptext(F,"movement")
x=c(-16,16,16,-16); y=c(-8,-8,8,8); polyC(x,y,"yellow") # [or spezzaC ]
ptext(A, "bicycle with\nchange gearing")
dart(-43,3.5, -16,3.5, 1); dart(-43,-3.5, -16,-3.5, 1)
dart(16,0, 43,0, 1)
 #
CLEAN(-70,70, -70,70)
A=c(0,0); Ptext(A, "bicycle with\nchange gearing")
B=c(-30,7); Ptext(B,"movement")
C=c(-30,-7); Ptext(C,"information")
D=c(-48,4); Ptext(D,"man")
E=c(-48,-4); Ptext(E,"man")
F=c(30,4); Ptext(F,"movement")
x=c(-16,16,16,-16); y=c(-8,-8,8,8); polyC(x,y,"yellow")
ptext(A, "bicycle with\nchange gearing")
dart(-43,3.5, -16,3.5, 1); dart(-43,-3.5, -16,-3.5, 1)
dart(16,0, 43,0, 1)
#
CLEAN(-70,70, -70,70)
A=c(0,0); Ptext(A, "bicycle with\nchange gearing")
B=c(-30,7); Ptext(B,"movement")
C=c(-30,-7); Ptext(C,"information")
D=c(-48,4); Ptext(D,"man")
E=c(-48,-4); Ptext(E,"man")
F=c(30,4); Ptext(F,"movement")
x=c(-16,16,16,-16); y=c(-8,-8,8,8); polyC(x,y,"yellow")
ptext(A, "bicycle with\nchange gearing")
dart(-43,3.5, -16,3.5, 1); dart(-43,-3.5, -16,-3.5, 1)
dart(16,0, 43,0, 1)
 boxW(-70,70, -70,70)
BOX()
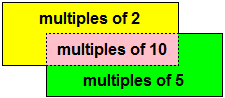
A = c(0, 0); A1="multiples of 10"
B = c(-10,20); B1="multiples of 2"
C = c(10,-20); C1="multiples of 5"
ptext(B,B1); ptext(C,C1); ptext(A,A1)
xA=c(-30,30,30,-30); yA=c(-10,-10,10,10)
xB=c(-50,30,30,-50); yB=c(-10,-10,30,30)
xC=c(-30,50,50,-30); yC=c(-30,-30,10,10)
polyC(xB,yB, "yellow"); polyC(xC,yC, "green")
polyD(xA,yA, "pink") # polyD dashes the border
ptext(B,B1); ptext(C,C1); ptext(A,A1)
#
CLEAN(-70,70, -70,70)
polyC(xB,yB, "yellow"); polyC(xC,yC, "green")
polyD(xA,yA, "pink")
ptext(B,B1); ptext(C,C1); ptext(A,A1)
boxW(-70,70, -70,70)
BOX()
A = c(0, 0); A1="multiples of 10"
B = c(-10,20); B1="multiples of 2"
C = c(10,-20); C1="multiples of 5"
ptext(B,B1); ptext(C,C1); ptext(A,A1)
xA=c(-30,30,30,-30); yA=c(-10,-10,10,10)
xB=c(-50,30,30,-50); yB=c(-10,-10,30,30)
xC=c(-30,50,50,-30); yC=c(-30,-30,10,10)
polyC(xB,yB, "yellow"); polyC(xC,yC, "green")
polyD(xA,yA, "pink") # polyD dashes the border
ptext(B,B1); ptext(C,C1); ptext(A,A1)
#
CLEAN(-70,70, -70,70)
polyC(xB,yB, "yellow"); polyC(xC,yC, "green")
polyD(xA,yA, "pink")
ptext(B,B1); ptext(C,C1); ptext(A,A1)
 # PtexT PtexT2 ptexT work like Ptext, Ptext2, ptext but with smaller letters: see the
# figure on the right
# Another example (N!):
# PtexT PtexT2 ptexT work like Ptext, Ptext2, ptext but with smaller letters: see the
# figure on the right
# Another example (N!):
 BF=4; HF=3
boxW(-50,50, -30,70)
BOX() # I put it to see the grid; then I take it off
x=c(-10,10,10,-10); y=c(60,60,70,70); polyC(x,y,"yellow")
A=c(0,65); ptexT(A,"input N")
dart(0,60, 0,50, 1)
x=c(-10,10,10,-10); y=c(30,30,50,50); polyC(x,y,"yellow")
A=c(0,45); ptexT(A,"i = 0")
A=c(0,35); ptexT(A,"P = 1")
dart(0,30, 0,20, 1)
x=c(-10,10,10,-10); y=c(10,10,20,20); polyC(x,y,"yellow")
A=c(0,15); ptexT(A," i = N ?")
dart(10,15, 20,15, 1)
A=c(15,20+2); ptexT(A,"yes")
A=c(5+2,5); ptexT(A,"no")
x=c(20,40,40,20); y=c(10,10,20,20); polyC(x,y,"yellow")
A=c(30,15); ptexT(A,"print P")
dart(0,10, 0,0, 1)
x=c(-10,10,10,-10); y=c(-20,-20,0,0); polyC(x,y,"yellow")
A=c(0,-5); ptexT(A,"i = i+1")
A=c(0,-15); ptexT(A,"P = P*i")
dart(-10,-10, -20,-10, 1)
dart(-20,-10, -20,15, 1)
dart(-20,15, -10,15, 1)
If we identify the scientific revolution as a feedback loop between research, power,
and resources that led to runaway growth:
BF=4; HF=3
boxW(-50,50, -30,70)
BOX() # I put it to see the grid; then I take it off
x=c(-10,10,10,-10); y=c(60,60,70,70); polyC(x,y,"yellow")
A=c(0,65); ptexT(A,"input N")
dart(0,60, 0,50, 1)
x=c(-10,10,10,-10); y=c(30,30,50,50); polyC(x,y,"yellow")
A=c(0,45); ptexT(A,"i = 0")
A=c(0,35); ptexT(A,"P = 1")
dart(0,30, 0,20, 1)
x=c(-10,10,10,-10); y=c(10,10,20,20); polyC(x,y,"yellow")
A=c(0,15); ptexT(A," i = N ?")
dart(10,15, 20,15, 1)
A=c(15,20+2); ptexT(A,"yes")
A=c(5+2,5); ptexT(A,"no")
x=c(20,40,40,20); y=c(10,10,20,20); polyC(x,y,"yellow")
A=c(30,15); ptexT(A,"print P")
dart(0,10, 0,0, 1)
x=c(-10,10,10,-10); y=c(-20,-20,0,0); polyC(x,y,"yellow")
A=c(0,-5); ptexT(A,"i = i+1")
A=c(0,-15); ptexT(A,"P = P*i")
dart(-10,-10, -20,-10, 1)
dart(-20,-10, -20,15, 1)
dart(-20,15, -10,15, 1)
If we identify the scientific revolution as a feedback loop between research, power,
and resources that led to runaway growth:
 BF=2; HF=2; BOXW(-1.45,1.45, -1.45,1.45) # Window without margins
ARCd(0,0, 1, 45+30,45-30, "blue")
ARCd(0,0, 1, 165+30,165-30, "blue")
ARCd(0,0, 1, 285+30,285-30, "blue")
text(xrot(45-60),yrot(45-60),"resources",cex=0.9,font=2)
text(xrot(165-60),yrot(165-60),"power",cex=0.9,font=2)
text(xrot(280-60),yrot(280-60),"research",cex=0.9,font=2)
Other examples of use
BF=2; HF=2; BOXW(-1.45,1.45, -1.45,1.45) # Window without margins
ARCd(0,0, 1, 45+30,45-30, "blue")
ARCd(0,0, 1, 165+30,165-30, "blue")
ARCd(0,0, 1, 285+30,285-30, "blue")
text(xrot(45-60),yrot(45-60),"resources",cex=0.9,font=2)
text(xrot(165-60),yrot(165-60),"power",cex=0.9,font=2)
text(xrot(280-60),yrot(280-60),"research",cex=0.9,font=2)
Other examples of use