# Temperatures in a certain month of the year (collected by 6-year-old pupils)
# How the teacher can make the chart (the pupils do it by hand on squared paper)
d = seq(1,31,1) # the days and the temperatures
t = c(8,10,10,13,13,12,10,10,8,10,10,15,10,10,9,14,10,10,13,10,9,10,11,14,9,11,13,13,12,11,12)
length(t) # I check if they are 31
# 31
BF=4.5; HF=2.5
Planeww(0,31, 0,15) # I use a "plane" without grid and axes
gridHC(1:15,"blue") # I draw a blue grid (small hatching)
gridVC(1:31,"blue")
GridHC(c(0,5,10,15),"black") # I draw a black grid (big hatching)
GridVC(c(0,5,10,15,20,25,30),"black")
# I write labels under the axes in particular positions
UnderX("1",1); UnderX("10",10); UnderX("20",20); UnderX("30",30)
UnderY("0",0); UnderY("5",5); UnderY("10",10); UnderY("15",15)
# I write labels above the axes
abovex("March"); abovey("°C")
AXES(0,0,"black") # I draw two black axes
# I draw a red polyline and black points
polylin(g,t, "red"); Point(g,t,"black")
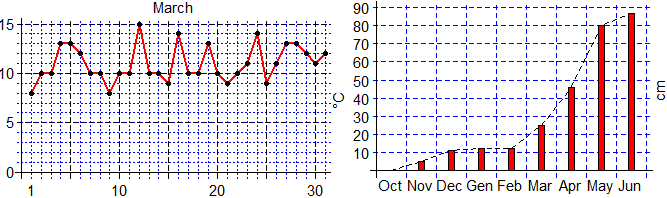 # The growth of the height of a wheat plant (at the beginning the pupils report squared
# paper strips, then use a reduced scale: 1 square = 2cm).
# How the teacher can later make the chart:
BF=4; HF=3.5
Planeww(0,45, 0,90)
GridVC(seq(0,45,5),"blue")
GridHC(seq(0,90,10),"blue")
AXES(0,0,"black")
g = seq(2.5,45,5)
h=c(0,5,11,12,12,25,46,80,87)
polyli(g,h, "black")
rect( 7,0, 8,h[2], col="red"); rect(12,0, 13,h[3], col="red")
rect(17,0, 18,h[4], col="red"); rect(22,0, 23,h[5], col="red")
rect(27,0, 28,h[6], col="red"); rect(32,0, 33,h[7], col="red")
rect(37,0, 38,h[8], col="red"); rect(42,0, 43,h[9], col="red")
UnderX("Oct",2.5); UnderX("Nov",7.5); UnderX("Dec",12.5)
UnderX("Gen",17.5); UnderX("Feb",22.5); UnderX("Mar",27.5)
UnderX("Apr",32.5); UnderX("May",37.5); UnderX("Jun",42.5)
UnderY("10",10); UnderY("20",20); UnderY("30",30)
UnderY("40",40); UnderY("50",50); UnderY("60",60)
UnderY("70",70); UnderY("80",80); UnderY("90",90)
abovey("cm")
# The growth of the height of a wheat plant (at the beginning the pupils report squared
# paper strips, then use a reduced scale: 1 square = 2cm).
# How the teacher can later make the chart:
BF=4; HF=3.5
Planeww(0,45, 0,90)
GridVC(seq(0,45,5),"blue")
GridHC(seq(0,90,10),"blue")
AXES(0,0,"black")
g = seq(2.5,45,5)
h=c(0,5,11,12,12,25,46,80,87)
polyli(g,h, "black")
rect( 7,0, 8,h[2], col="red"); rect(12,0, 13,h[3], col="red")
rect(17,0, 18,h[4], col="red"); rect(22,0, 23,h[5], col="red")
rect(27,0, 28,h[6], col="red"); rect(32,0, 33,h[7], col="red")
rect(37,0, 38,h[8], col="red"); rect(42,0, 43,h[9], col="red")
UnderX("Oct",2.5); UnderX("Nov",7.5); UnderX("Dec",12.5)
UnderX("Gen",17.5); UnderX("Feb",22.5); UnderX("Mar",27.5)
UnderX("Apr",32.5); UnderX("May",37.5); UnderX("Jun",42.5)
UnderY("10",10); UnderY("20",20); UnderY("30",30)
UnderY("40",40); UnderY("50",50); UnderY("60",60)
UnderY("70",70); UnderY("80",80); UnderY("90",90)
abovey("cm")