---------- ---------- ---------- ---------- ---------- ---------- ---------- ----------
Some commands that can be useful for making some figures.
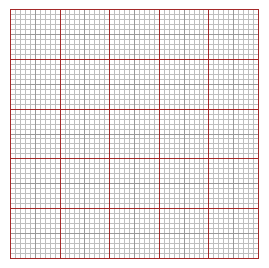
We recall that the rectangle of millimeter paper shown below is obtained with
mmpaper1() (other paper are obtained with mmpaper2/3)
 In the same scale I can draw circles, by CiRcLe(n) [in the n^ quadrant), and graduated
segments, in a given direction, by dMmM or (without opening a new window) DMmM. Here's
what I can get by putting together the images produced with CiRcLe(1) CiRcLe(2) and
mmpaper1()
In the same scale I can draw circles, by CiRcLe(n) [in the n^ quadrant), and graduated
segments, in a given direction, by dMmM or (without opening a new window) DMmM. Here's
what I can get by putting together the images produced with CiRcLe(1) CiRcLe(2) and
mmpaper1()
 # Radius of lenght 50 and inclination 30°
dMmM(30)
text(25,10,"30°")
POINT(27,31,"red")
inclination(0,0, 27,31)
# 48.94519
# I obtain the figure below on the left
# Radius of inclination 48.94519°
DMmM(48.94519)
# I "read" the distance is about 41 mm
# I calculate it
point_point(0,0, 27,31)
# 41.10961
# OK
POINT(27,31,"red")
text(30,27,"48.95°")
# Radius of lenght 50 and inclination 30°
dMmM(30)
text(25,10,"30°")
POINT(27,31,"red")
inclination(0,0, 27,31)
# 48.94519
# I obtain the figure below on the left
# Radius of inclination 48.94519°
DMmM(48.94519)
# I "read" the distance is about 41 mm
# I calculate it
point_point(0,0, 27,31)
# 41.10961
# OK
POINT(27,31,"red")
text(30,27,"48.95°")
 mmpaper1()
DMmM(30)
DMmM(48.94519)
mmpaper1()
DMmM(30)
DMmM(48.94519)
 circl(0,0, 50, "blue")
CiRcLe(3)
DMmM(180)
DMmM(180+45)
DMmM(180+90)
circl(0,0, 50, "blue")
CiRcLe(3)
DMmM(180)
DMmM(180+45)
DMmM(180+90)
 #
# I can put millimeter card on the background of a chart.
# Example.
#
# Employment rate in Italy
x <- c(1861,1871,1881,1901,1911,1921,1931,1936,1951,1961,1971,1981)
y <- c(59,57,54,50,48,47,46,45,43,40,37,45)
Plane(1860,1990, 0,60)
polyl(x,y,"blue"); POINT(x,y,"brown")
#
# I can put millimeter card on the background of a chart.
# Example.
#
# Employment rate in Italy
x <- c(1861,1871,1881,1901,1911,1921,1931,1936,1951,1961,1971,1981)
y <- c(59,57,54,50,48,47,46,45,43,40,37,45)
Plane(1860,1990, 0,60)
polyl(x,y,"blue"); POINT(x,y,"brown")
 #
# x varies by 1990-1860 = 130, y by 60-0 = 60
# I use a chart 130 mm × 60 mm:
Planew(1860,1990, 0,60)
MmPaper(130, 60)
polyl(x,y,"blue"); POINT(x,y,"black")
#
# x varies by 1990-1860 = 130, y by 60-0 = 60
# I use a chart 130 mm × 60 mm:
Planew(1860,1990, 0,60)
MmPaper(130, 60)
polyl(x,y,"blue"); POINT(x,y,"black")
 #
# I can resize the window to see square "squares".
Other examples of use
#
# I can resize the window to see square "squares".
Other examples of use