source("http://macosa.dima.unige.it/r.R") # If I have not already loaded the library
---------- ---------- ---------- ---------- ---------- ---------- ---------- ----------
S 02 Inequalities and systems of inequalities (and plane regions)
diseq(F,G, h,k, col) punctuates (using the color col) the space between the graphs of
F and G [F(x) < G(x)] and the vertical lines x=h, x=k. If necessary, repeat the command
to get additional points, or use Diseq.
diseq1(F, k, col) punctuates where the fun. of 2 var. F is lower than k
diseq2(F, k, col) punctuates where the fun. of 2 var. F is greater than k
Diseq, Diseq1, Diseq2 repeat the same action 5 times.
I can also solve systems of inequalities
FIGURE(P, a,b,c,d, col) plots the points of a plane region.
F = function(x) x*(x-2); G = function(x) x/2
graphF(F,-1,3, "blue"); graph(G,-1,3, "red")
# See the charts below to the left
diseq(F,G,-1,3,"black"); diseq(G,F,-1,3,"orange")
# or:
Diseq(F,G,-1,3,"black"); Diseq(G,F,-1,3,"orange")
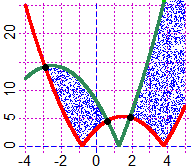 # For the chart on the right ( |x^2-3*x-3| < |x^2+5*x-8| ) see here
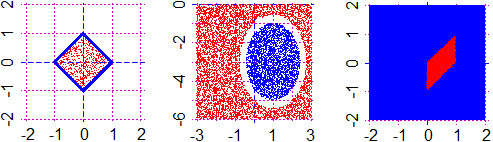
k = function(x,y) abs(x)+abs(y)-1 # see below on the left
PLANE(-2,2, -2,2); CURVE(k,"blue"); diseq1(k,0,"red")
#
h = function(x,y) (x-1)^2+0.5*(y+3)^2 # see below in the center
# where h < 2, where h > 3
PLANE(-3,3, -6,0)
Diseq1(h,2, "blue")
Diseq2(h,3, "red")
#
P = function(x,y) x >= y & x-y <=1 & 0 <= x & x <= 1
# where P is true (val. 1), where is false (val. 0) (see)
PLANE(-2,2, -2,2) # see below on the right
Diseq1(P,1,"blue") # false (val. < 1)
Diseq2(P,0, "red") # true (val. > 0)
Diseq1(P,1,"blue"); Diseq2(P,0,"red")
# For the chart on the right ( |x^2-3*x-3| < |x^2+5*x-8| ) see here
k = function(x,y) abs(x)+abs(y)-1 # see below on the left
PLANE(-2,2, -2,2); CURVE(k,"blue"); diseq1(k,0,"red")
#
h = function(x,y) (x-1)^2+0.5*(y+3)^2 # see below in the center
# where h < 2, where h > 3
PLANE(-3,3, -6,0)
Diseq1(h,2, "blue")
Diseq2(h,3, "red")
#
P = function(x,y) x >= y & x-y <=1 & 0 <= x & x <= 1
# where P is true (val. 1), where is false (val. 0) (see)
PLANE(-2,2, -2,2) # see below on the right
Diseq1(P,1,"blue") # false (val. < 1)
Diseq2(P,0, "red") # true (val. > 0)
Diseq1(P,1,"blue"); Diseq2(P,0,"red")
 #
# Using the FIGURE(P, a,b,c,d, col) command I can color any plane shape. Some example.
# [P: the condition; a,b,c,d: the space; col: the colour]
BF=2.5; HF=5; PLANE(-5,5, -5,5)
Q = function(x,y) x^2+y^2 > 4 & x^2+y^2 < 25
for(i in 1:30) FIGURE(Q, -5,5, -5,5, "brown")
Q = function(x,y) x^2+y^2 > 9 & x^2+y^2 < 16
for(i in 1:20) FIGURE(Q, -5,5, -5,5, "green")
#
# Using the FIGURE(P, a,b,c,d, col) command I can color any plane shape. Some example.
# [P: the condition; a,b,c,d: the space; col: the colour]
BF=2.5; HF=5; PLANE(-5,5, -5,5)
Q = function(x,y) x^2+y^2 > 4 & x^2+y^2 < 25
for(i in 1:30) FIGURE(Q, -5,5, -5,5, "brown")
Q = function(x,y) x^2+y^2 > 9 & x^2+y^2 < 16
for(i in 1:20) FIGURE(Q, -5,5, -5,5, "green")

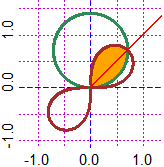 PLANE(-1.25,1.25, -1,1.5)
R1 = function(t) sqrt(2)*sin(t); R2 = function(t) sqrt(sin(2*t))
polar(R1,0,2*pi, "seagreen"); polar(R2,0,2*pi, "brown")
P=function(x,y) {r=sqrt(x^2+y^2); t=dirArrow1(0,0, x,y)*pi/180; r<=sqrt(sin(t*2)) & r<=sqrt(2)*sin(t)}
for(i in 1:8) FIGURE(P,0,1,0,1, "orange")
polar(R1,0,2*pi, "seagreen"); polar(R2,0,2*pi, "brown")
f = function(x) x; graph1(f, 0,2, "red")
#
# Caution: the software is not enough
# Let's see the resolution of 3/(4*x – 5) > 4.
Plane(-5,5, -5,5)
f = function(x) 3/(4*x-5); g = function(x) 4
graph(f,-5,5, 1); graph(g,-5,5, "red")
# I understand that the solutions are in a range between 0 and 2, but to represent the
# inequality I need an interval in which the two graphs do not jump. Where is the jump?
# I solve the equation 4*x-5=0.
# It's easy, but let's see how to do it with the computer:
h = function(x) 4*x-5; soluz(h,0, 0,2)
# 1.25
Plane(0,2,-1,8); graph(f,0,2, 1); graph(g,0,2, "red")
Diseq(g,f, 1.25,2, "brown")
PLANE(-1.25,1.25, -1,1.5)
R1 = function(t) sqrt(2)*sin(t); R2 = function(t) sqrt(sin(2*t))
polar(R1,0,2*pi, "seagreen"); polar(R2,0,2*pi, "brown")
P=function(x,y) {r=sqrt(x^2+y^2); t=dirArrow1(0,0, x,y)*pi/180; r<=sqrt(sin(t*2)) & r<=sqrt(2)*sin(t)}
for(i in 1:8) FIGURE(P,0,1,0,1, "orange")
polar(R1,0,2*pi, "seagreen"); polar(R2,0,2*pi, "brown")
f = function(x) x; graph1(f, 0,2, "red")
#
# Caution: the software is not enough
# Let's see the resolution of 3/(4*x – 5) > 4.
Plane(-5,5, -5,5)
f = function(x) 3/(4*x-5); g = function(x) 4
graph(f,-5,5, 1); graph(g,-5,5, "red")
# I understand that the solutions are in a range between 0 and 2, but to represent the
# inequality I need an interval in which the two graphs do not jump. Where is the jump?
# I solve the equation 4*x-5=0.
# It's easy, but let's see how to do it with the computer:
h = function(x) 4*x-5; soluz(h,0, 0,2)
# 1.25
Plane(0,2,-1,8); graph(f,0,2, 1); graph(g,0,2, "red")
Diseq(g,f, 1.25,2, "brown")
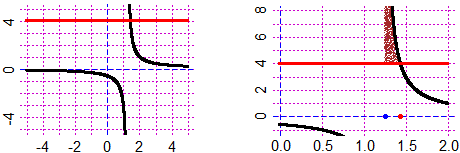 # I have a graphic confirmation: punctuation shows that the solution is the interval
# (1.25,q). To find q I realize that the curves are between 1.25 and 1.5:
soluz2(f,g, 1.25,1.5)
# 1.4375
# To have the interval in a fractional form:
fraction(1.25); fraction(1.4375)
# 5/4 23/16
Point(5/4,0,"blue"); Point(23/16,0,"red")
#
# For linear programming see here.
Other examples of use
# I have a graphic confirmation: punctuation shows that the solution is the interval
# (1.25,q). To find q I realize that the curves are between 1.25 and 1.5:
soluz2(f,g, 1.25,1.5)
# 1.4375
# To have the interval in a fractional form:
fraction(1.25); fraction(1.4375)
# 5/4 23/16
Point(5/4,0,"blue"); Point(23/16,0,"red")
#
# For linear programming see here.
Other examples of use