source("http://macosa.dima.unige.it/r.R")    # If I have not already loaded the library
---------- ---------- ---------- ---------- ---------- ---------- ---------- ----------
S 13 Bezier curves

You can trace curves by introducing points that guide the trend (Bezier method).
After putting the coordinates in X and Y and choosing a scale, use
bezier(X,Y,N)    [bezie(…) for thin-stroke curves]   where N is 0 or a color code. Try
bezier(a,b,1)  bezier(a,b,0)  bezier(a,b,"grey")     after you have introduced:
a <- c(-3,2,2,-1); b <- c(2,2,-2,1)

PLANE(-3,3, -3,3)
a <- c(-3,2,2,-1); b <- c(2,2,-2,1)
bezier(a,b,1); bezier(a,b,0); bezier(a,b,"grey")

PLANE(-1,1,-1,1)
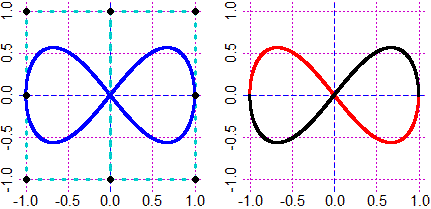
xx <- c(-1,-1,0,0,1,1)
yy <- c(0,1,1,-1,-1,0)
bezier(xx,yy,0); bezier(xx,-yy,0)
PLANE(-1,1,-1,1)
bezier(xx,yy,"red"); bezier(xx,-yy,"black")
PLANE(-1,1,-1,1)
xx <- c(-1,-1,0,0,1,1)
yy <- c(0,1,1,-1,-1,0)
bezier(xx,yy,0); bezier(xx,-yy,0)
PLANE(-1,1,-1,1)
bezier(xx,yy,"red"); bezier(xx,-yy,"black")

If the point are 3 the curve is a
parabola:

PLANE(-5,5, -5,5)
bezier(c(-4,0,4),c(-5,5,-5), "red")
POINT(0,5,"blue")
POINT(-4,-5,"blue")
POINT(4,-5,"blue")
xy_3(c(-4,0,4),c(-5,0,-5))
# = function(x) 0 + 0 *x + -0.3125 *x^2
f = function(x)  0 + 0 *x + -0.3125 *x^2
graph1(f, -5,5, "green")
POINT(0,0,"red") | |  |
 |
|
On the left as Italy (see here) appears, approximating
the outline with splines (if I consider more points the
approximation became better):

X1=xTab(Italy1); Y1=yTab(Italy1)   # penisula
X2=xTab(Italy2); Y2=yTab(Italy2)   # Sicilia
X3=xTab(Italy3); Y3=yTab(Italy3)   # Sardegna
BF=4; HF=4; Plane(6,19, 36,48)
bezie(X1,Y1,"brown")
bezie(X2,Y2,"brown"); bezie(X3,Y3,"brown")
|
# Other examples here
Other examples of use
 PLANE(-1,1,-1,1)
xx <- c(-1,-1,0,0,1,1)
yy <- c(0,1,1,-1,-1,0)
bezier(xx,yy,0); bezier(xx,-yy,0)
PLANE(-1,1,-1,1)
bezier(xx,yy,"red"); bezier(xx,-yy,"black")
PLANE(-1,1,-1,1)
xx <- c(-1,-1,0,0,1,1)
yy <- c(0,1,1,-1,-1,0)
bezier(xx,yy,0); bezier(xx,-yy,0)
PLANE(-1,1,-1,1)
bezier(xx,yy,"red"); bezier(xx,-yy,"black")


