source("http://macosa.dima.unige.it/r.R") # If I have not already loaded the library
---------- ---------- ---------- ---------- ---------- ---------- ---------- ----------
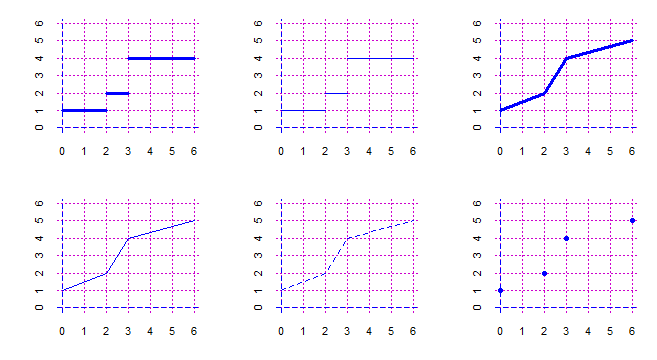
S 17 Multiple graphs (in the same window)
x = c(0,2,3,6); y = c(1,2,4,5)
rowcol(2,3) # or: colrow(3,2)
BoxW(0,6,0,6); BOX(); stepline(x,y, "blue"); BoxW(0,6,0,6); stepl(x,y, "blue")
Box_(0,6,0,6); polyline(x,y, "brown"); Box_(0,6,0,6); polyli(x,y, "seagreen")
Boxm_(0,6,0,6); POINT(x,y, "red"); Box_(0,6,0,6); POINT(x,y, "blue")
 rowcol(m,n) [or colrow(n,m)] predisposes to make graphs in a multiple window (m rows,
n columns)
Box_ opens a subwindow, and leaves the margins
Boxm_ opens a monometric subwindow, and leaves the margins
BoxW opens a subwindow without leaving the margins [and without grid - if I want it I
BoxmW opens a monometric subwindow without leaving the margins use BOX()]
BoxWW opens a subwindow leaving little margins [and without grid - if I want it I
BoxmWW opens a monometric subwindow leaving little margins use BOX()]
BoxW_ opens a subwindow leaving the margins, without grid - if I want it I use BOX()
BoxmW_ opens a monometric subwindow leaving ...
stepline does not connect the "y"
stepl like stepline, with thin lines
Another example:
rowcol(2,3); x = c(0,2,3,6); y = c(1,2,4,5)
Box_(0,6,0,6); stepline(x,y, "blue"); Box_(0,6,0,6); stepl(x,y, "blue")
Box_(0,6,0,6); polyline(x,y, "blue"); Box_(0,6,0,6); polyl(x,y, "blue")
Box_(0,6,0,6); polyli(x,y, "blue"); Box_(0,6,0,6); POINT(x,y, "blue")
rowcol(m,n) [or colrow(n,m)] predisposes to make graphs in a multiple window (m rows,
n columns)
Box_ opens a subwindow, and leaves the margins
Boxm_ opens a monometric subwindow, and leaves the margins
BoxW opens a subwindow without leaving the margins [and without grid - if I want it I
BoxmW opens a monometric subwindow without leaving the margins use BOX()]
BoxWW opens a subwindow leaving little margins [and without grid - if I want it I
BoxmWW opens a monometric subwindow leaving little margins use BOX()]
BoxW_ opens a subwindow leaving the margins, without grid - if I want it I use BOX()
BoxmW_ opens a monometric subwindow leaving ...
stepline does not connect the "y"
stepl like stepline, with thin lines
Another example:
rowcol(2,3); x = c(0,2,3,6); y = c(1,2,4,5)
Box_(0,6,0,6); stepline(x,y, "blue"); Box_(0,6,0,6); stepl(x,y, "blue")
Box_(0,6,0,6); polyline(x,y, "blue"); Box_(0,6,0,6); polyl(x,y, "blue")
Box_(0,6,0,6); polyli(x,y, "blue"); Box_(0,6,0,6); POINT(x,y, "blue")
 Another:
 rowcol(1,4)
BoxWW(-1,1,0,1); BOX()
underx("[-1, 1]"); undery("[0, 1]")
graph(abs,-1,1, "brown")
BoxWW(-4,7,-1,1); BOX()
underx("[-4, 7]"); undery("[-1, 1]")
graph(cos,-4,7, "brown")
BoxWW(0,2,-3,1); BOX()
underx("[0, 2]"); undery("[-3, 1]")
f=function(x) log(x,10)
graph(f,0,2, "brown")
g=function(x) 1/x
BoxWW(-3,3,-3,3); BOX()
underx("[-3, 3]"); undery("[-3, 3]")
graph(g,-3,3, "brown")
Another:
dev.new(width=5, height=4); rowcol(3,1) # for dev.new see
a=0; b=15; c=-2; d=2
f = function(x) 0.6*sin(x-pi/2); g = function(x) 1.2*sin(2*x+pi/2); h = function(x) f(x)+g(x)
BoxWW(a,b, c,d); BOX(); graph2(f,a,b, "blue")
abovex("f(x)+0.6*sin(x-pi/2)"); underX(c(0,5,10,15),c(0,5,10,15) ); underY(c(-2,0,2),c(-2,0,2) )
BoxWW(a,b, c,d); BOX(); graph2(g,a,b, "red")
abovex("g(x)=1.2*sin(2*x+pi/2)"); underX(c(0,5,10,15),c(0,5,10,15) ); underY(c(-2,0,2),c(-2,0,2) )
BoxWW(a,b, c,d); BOX(); graph1(f,a,b, "blue"); graph1(g,a,b, "red"); graph(h,a,b, "brown")
abovex("f+g"); underX(c(0,5,10,15),c(0,5,10,15) ); underY(c(-2,0,2),c(-2,0,2) )
for(x in pi*(1:5)) POINT(x,0,"black"); text(pi,-1/2,bquote(pi))
rowcol(1,4)
BoxWW(-1,1,0,1); BOX()
underx("[-1, 1]"); undery("[0, 1]")
graph(abs,-1,1, "brown")
BoxWW(-4,7,-1,1); BOX()
underx("[-4, 7]"); undery("[-1, 1]")
graph(cos,-4,7, "brown")
BoxWW(0,2,-3,1); BOX()
underx("[0, 2]"); undery("[-3, 1]")
f=function(x) log(x,10)
graph(f,0,2, "brown")
g=function(x) 1/x
BoxWW(-3,3,-3,3); BOX()
underx("[-3, 3]"); undery("[-3, 3]")
graph(g,-3,3, "brown")
Another:
dev.new(width=5, height=4); rowcol(3,1) # for dev.new see
a=0; b=15; c=-2; d=2
f = function(x) 0.6*sin(x-pi/2); g = function(x) 1.2*sin(2*x+pi/2); h = function(x) f(x)+g(x)
BoxWW(a,b, c,d); BOX(); graph2(f,a,b, "blue")
abovex("f(x)+0.6*sin(x-pi/2)"); underX(c(0,5,10,15),c(0,5,10,15) ); underY(c(-2,0,2),c(-2,0,2) )
BoxWW(a,b, c,d); BOX(); graph2(g,a,b, "red")
abovex("g(x)=1.2*sin(2*x+pi/2)"); underX(c(0,5,10,15),c(0,5,10,15) ); underY(c(-2,0,2),c(-2,0,2) )
BoxWW(a,b, c,d); BOX(); graph1(f,a,b, "blue"); graph1(g,a,b, "red"); graph(h,a,b, "brown")
abovex("f+g"); underX(c(0,5,10,15),c(0,5,10,15) ); underY(c(-2,0,2),c(-2,0,2) )
for(x in pi*(1:5)) POINT(x,0,"black"); text(pi,-1/2,bquote(pi))
 Other here (to operate simultaneously on multiple windows) or here
 Other examples of use