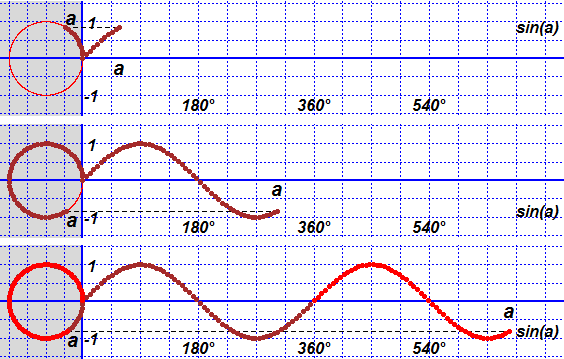
# y = sin(x)
#
BF=6; HF=1.5
BOXW(-2,12.5, -1.5,1.5)
polyC(c(-5,0,0,-5),c(-8,-8,8,8), "grey85")
polyline(c(-5,0,0,-5),c(-8,-8,8,8), "white")
abline(h=seq(-2,2,1/2),v=seq(-2,0,1/2),lty=3,col="blue")
abline(v=seq(0,13,pi/4),lty=3,col="blue")
abline(v=0,h=0,col="blue",lwd=2)
circl(-1,0, 1, "red")
for(x in seq(0,11.6, 0.1)) { CLEAN(-2,13,-1.5,1.5)
polyC(c(-5,0,0,-5),c(-8,-8,8,8), "grey85")
polyline(c(-5,0,0,-5),c(-8,-8,8,8), "white")
abline(h=seq(-2,2,1/2),v=seq(-2,0,1/2),lty=3,col="blue")
abline(v=seq(0,13,pi/4),lty=3,col="blue"); abline(v=0,h=0,col="blue",lwd=2)
circl(-1,0, 1, "red")
c <- "brown"; text(cos(x)*1.3-1,sin(x)*1.3,"a",font=4,cex=1.2); text(x,-0.25,"a",font=4,cex=1.2)
lines(c(cos(x)-1,x),c(sin(x),sin(x)),lty=2)
for (xx in seq(0,x,0.1)) { if (xx > 2*pi) c <- "red";
points(cos(xx)-1,sin(xx),pch=20,col=c); points(xx,sin(xx),pch=20,col=c) }
text(pi,-1.25,"180°",font=4); text(2*pi,-1.25,"360°",font=4); text(3*pi,-1.25,"540°",font=4)
text(0.25,1,"1",font=4); text(0.23,-1,"-1",font=4)
text(12.4,sin(x),"sin(a)",font=4)
wait(1/4) }
 # Replace wait(1/4) with locator(1) to have an animation guided by you (see)
# y = cos(x)
#
BF=6; HF=1.5
BOXW(-2,12.5, -1.5,1.5)
polyC(c(-5,0,0,-5),c(-8,-8,8,8), "grey85")
polyline(c(-5,0,0,-5),c(-8,-8,8,8), "white")
abline(h=seq(-2,2,1/2),v=seq(-2,0,1/2),lty=3,col="blue")
abline(v=seq(0,13,pi/4),lty=3,col="blue")
abline(v=0,h=0,col="blue",lwd=2)
circl(-1,0, 1, "red")
for(x in seq(0,11.6, 0.1)) { CLEAN(-2,13,-1.5,1.5)
polyC(c(-5,0,0,-5),c(-8,-8,8,8), "grey85")
polyline(c(-5,0,0,-5),c(-8,-8,8,8), "white")
abline(h=seq(-2,2,1/2),v=seq(-2,0,1/2),lty=3,col="blue")
abline(v=seq(0,13,pi/4),lty=3,col="blue"); abline(v=0,h=0,col="blue",lwd=2)
circl(-1,0, 1, "red"); line(-1,1/2,-1,0, "black")
POINT(-1,1/2,"black"); ARC(-1,0, 1/2, 90,180, "blue"); arrow(-1.48,0.1,-1.5,0,"blue")
arc(-1,0, 1/2, 90,180, "black"); dart(-1.48,0.1,-1.5,0,"black")
c <- "brown"; text(cos(x+pi/2)*1.3-1,sin(x+pi/2)*1.3,"a",font=4,cex=1.2); text(x,-0.25,"a",font=4,cex=1.2)
lines(c(cos(x+pi/2)-1,x),c(cos(x),cos(x)),lty=2)
for (xx in seq(0,x,0.1)) { if (xx > 2*pi) c <- "red";
points(cos(xx+pi/2)-1,sin(xx+pi/2),pch=20,col=c); points(xx,cos(xx),pch=20,col=c) }
text(pi,-1.25,"180°",font=4); text(2*pi,-1.25,"360°",font=4); text(3*pi,-1.25,"540°",font=4)
text(0.24,1,"I",font=4,col="white",cex=3)
text(0.25,1,"1",font=4,col="blue"); text(0.23,-1,"-1",font=4,col="blue")
text(12.4,cos(x),"cos(a)",font=4); text(cos(x+pi/2)*1.3-1,sin(x+pi/2)*1.3,"a",font=4,cex=1.2)
wait(1/4) }
# Replace wait(1/4) with locator(1) to have an animation guided by you (see)
# y = cos(x)
#
BF=6; HF=1.5
BOXW(-2,12.5, -1.5,1.5)
polyC(c(-5,0,0,-5),c(-8,-8,8,8), "grey85")
polyline(c(-5,0,0,-5),c(-8,-8,8,8), "white")
abline(h=seq(-2,2,1/2),v=seq(-2,0,1/2),lty=3,col="blue")
abline(v=seq(0,13,pi/4),lty=3,col="blue")
abline(v=0,h=0,col="blue",lwd=2)
circl(-1,0, 1, "red")
for(x in seq(0,11.6, 0.1)) { CLEAN(-2,13,-1.5,1.5)
polyC(c(-5,0,0,-5),c(-8,-8,8,8), "grey85")
polyline(c(-5,0,0,-5),c(-8,-8,8,8), "white")
abline(h=seq(-2,2,1/2),v=seq(-2,0,1/2),lty=3,col="blue")
abline(v=seq(0,13,pi/4),lty=3,col="blue"); abline(v=0,h=0,col="blue",lwd=2)
circl(-1,0, 1, "red"); line(-1,1/2,-1,0, "black")
POINT(-1,1/2,"black"); ARC(-1,0, 1/2, 90,180, "blue"); arrow(-1.48,0.1,-1.5,0,"blue")
arc(-1,0, 1/2, 90,180, "black"); dart(-1.48,0.1,-1.5,0,"black")
c <- "brown"; text(cos(x+pi/2)*1.3-1,sin(x+pi/2)*1.3,"a",font=4,cex=1.2); text(x,-0.25,"a",font=4,cex=1.2)
lines(c(cos(x+pi/2)-1,x),c(cos(x),cos(x)),lty=2)
for (xx in seq(0,x,0.1)) { if (xx > 2*pi) c <- "red";
points(cos(xx+pi/2)-1,sin(xx+pi/2),pch=20,col=c); points(xx,cos(xx),pch=20,col=c) }
text(pi,-1.25,"180°",font=4); text(2*pi,-1.25,"360°",font=4); text(3*pi,-1.25,"540°",font=4)
text(0.24,1,"I",font=4,col="white",cex=3)
text(0.25,1,"1",font=4,col="blue"); text(0.23,-1,"-1",font=4,col="blue")
text(12.4,cos(x),"cos(a)",font=4); text(cos(x+pi/2)*1.3-1,sin(x+pi/2)*1.3,"a",font=4,cex=1.2)
wait(1/4) }
 # This is an alternative:
 # y = sin(x)
#
f <- function(x) sin(x)
ang <- 0; dang <- pi/24
dev.new(width=6, height=3)
rowcol(1,2)
while (ang < 3.2*pi) {
# left
Boxm_(-1,1, -1,1)
circl(0,0, 1, "red")
ang <- ang+dang; POINT(c(0,cos(ang)), c(0,sin(ang)), "blue" )
lines(c(0,cos(ang)), c(0,sin(ang)), lty=3 )
lines(c(1,0), c(0,0), col="red")
lines(c(cos(ang),cos(ang)), c(0,sin(ang)) ,lwd=2)
text(cos(ang)*.7,sin(ang)*.7,"x",col="red")
text(cos(ang),sin(ang)/2,"I",col="white")
text(cos(ang),sin(ang)/2,"sin",col="red",font=4)
# right
Box_(0,10, -1,1)
abline(v=seq(pi/2,3*pi,pi/2),lty=3, col="red",lwd=2)
plot(f,0,ang,add=TRUE,lwd=2); POINT( ang,sin(ang), "blue")
wait(1/3)
}
#
# y = sin(x)
#
f <- function(x) sin(x)
ang <- 0; dang <- pi/24
dev.new(width=6, height=3)
rowcol(1,2)
while (ang < 3.2*pi) {
# left
Boxm_(-1,1, -1,1)
circl(0,0, 1, "red")
ang <- ang+dang; POINT(c(0,cos(ang)), c(0,sin(ang)), "blue" )
lines(c(0,cos(ang)), c(0,sin(ang)), lty=3 )
lines(c(1,0), c(0,0), col="red")
lines(c(cos(ang),cos(ang)), c(0,sin(ang)) ,lwd=2)
text(cos(ang)*.7,sin(ang)*.7,"x",col="red")
text(cos(ang),sin(ang)/2,"I",col="white")
text(cos(ang),sin(ang)/2,"sin",col="red",font=4)
# right
Box_(0,10, -1,1)
abline(v=seq(pi/2,3*pi,pi/2),lty=3, col="red",lwd=2)
plot(f,0,ang,add=TRUE,lwd=2); POINT( ang,sin(ang), "blue")
wait(1/3)
}
#
 #
# y = cos(x)
#
f <- function(x) cos(x)
ang <- 0; dang <- pi/24
dev.new(width=6, height=3)
rowcol(1,2)
while (ang < 3.2*pi) {
# left
Boxm_(-1,1, -1,1)
cerch(0,0, 1, "red")
ang <- ang+dang; POINT(c(0,cos(ang)), c(0,sin(ang)), "blue" )
lines(c(0,cos(ang)), c(0,sin(ang)), lty=3 )
lines(c(1,0), c(0,0), col="red")
lines(c(0,cos(ang)), c(sin(ang),sin(ang)) ,lwd=2)
text(cos(ang)*.7,sin(ang)*.7,"x",col="red")
text(cos(ang)/2,sin(ang),"###",col="white")
text(cos(ang)/2,sin(ang),"cos",col="red",font=4)
# right
Box_(0,10, -1,1)
abline(v=seq(pi/2,3*pi,pi/2),lty=3, col="red",lwd=2)
plot(f,0,ang,add=TRUE,lwd=2); POINT( ang,cos(ang), "blue")
wait(1/3)
}
#
# y = cos(x)
#
f <- function(x) cos(x)
ang <- 0; dang <- pi/24
dev.new(width=6, height=3)
rowcol(1,2)
while (ang < 3.2*pi) {
# left
Boxm_(-1,1, -1,1)
cerch(0,0, 1, "red")
ang <- ang+dang; POINT(c(0,cos(ang)), c(0,sin(ang)), "blue" )
lines(c(0,cos(ang)), c(0,sin(ang)), lty=3 )
lines(c(1,0), c(0,0), col="red")
lines(c(0,cos(ang)), c(sin(ang),sin(ang)) ,lwd=2)
text(cos(ang)*.7,sin(ang)*.7,"x",col="red")
text(cos(ang)/2,sin(ang),"###",col="white")
text(cos(ang)/2,sin(ang),"cos",col="red",font=4)
# right
Box_(0,10, -1,1)
abline(v=seq(pi/2,3*pi,pi/2),lty=3, col="red",lwd=2)
plot(f,0,ang,add=TRUE,lwd=2); POINT( ang,cos(ang), "blue")
wait(1/3)
}