| [> |
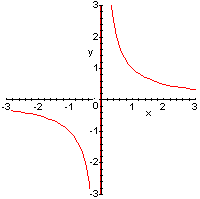
plot(1/x,x=-3..3,y=-3..3);
 |
| [> | plot([x,x^2,1/x],x=-3..3,y=-3..3); [Enter] |
| [> | t:=(a*y+b*x)/(x*y); |
| [> | expand(t); |
| [> | solve(t=1,a); |
| [> | factor(t+x/y); |
| [> | f:=x->x; g:=x->x^2; plot([f,g,f+g],-3..3,-3..3, color=[red,green,blue]); |
| [> | limit(f(x),x=infinity); limit(2^x,x=-infinity); limit ((x-3)/(4-x),x=4); limit((x-3)/(4-x),x=4, right); limit((x-3)/(4-x),x=4, left); |
| [> | with(stats): Dati:=[7.3, 7.1, 7.2, 6.9, 7.2, 7.3, 7.4, 7.0, 7.1, 7.2, 7.3, 7.5]:
describe[mean](Dati); describe[percentile[50]](Dati); |
| [> | DatiClass:=transform[tallyinto](Dati,[6.8..7,7..7.2,7.2..7.4,7.4..7.6]):
statplots[histogram](DatiClass); |
| [> | # CAMPO DIREZIONALE dell'eq. differenziale y'(x) = f(x,y). Metti il nome di una f da te definita e il rettangolo in cui studiare la eq.diff. nella chiamata di CampoDir
# ---------
CampoDir := proc(f,xsin,xdes,ygiu,ysu)
local Df, Nx, Ny, hx, hy, i, x, y, A, j, rap, T:
Df:=(x,y)->f(x,y): Nx:=20 : Ny:=20: hx:=(xdes-xsin)/Nx: hy:=(ysu-ygiu)/Ny: for i from 1 to Nx do x[i]:=xsin+hx*(i-.5) od : for i from 1 to Ny do y[i]:=ygiu+hy*(i-.5) od: A := array(1..Nx*Ny):for i from 1 to Nx do for j from 1 to Ny do
if abs(Df(x[i],y[j]))>abs(hy) then rap:= hy/(Df(x[i],y[j])*hx) else rap:=1 fi: rap:=rap*0.7: A[i+Nx*(j-1)] :=[[x[i]-hx/2*rap,y[j]-Df(x[i],y[j])*hx/2*rap],[x[i]+hx/2*rap,y[j]+Df(x[i],y[j])*hx/2*rap]] od od: T:=convert(A,list): plot(T ,color=blue)
end: |
| [> | f:=(x,y)->x : CampoDir(f,-4,4,-4,4); |
| [> | f:=(x,y)->-y/x : CampoDir(f,-4,4,-4,4); |