model and
reality
On some mathematical concepts / themes to be faced in the lower secondary school
("interwoven" within teaching units)
[primary - A primary - B lower secondary upper secondary - A upper secondary - B school]
The concept of model
The concept of number
Exponentiation
Elementary arithmetic
The concepts of ratio and proportionality
The diagrams
Approximations
Calculators. Computer. Logic
Descriptive statistics
Formulas, terms, graphs
The concepts of function and resolution of an equation
Space
Inverse proportionality
Theory of probability
Relations with the other disciplinary areas
The same contents present in the document relating to the previous level and the next school level are more or less faced, with a different slant.
The indications refer to how much should be faced on average in the lower secondary school.
They are presented articulated by thematic areas but, as it is clarified, in the didactic paths the different mathematical concepts must intertwine with each other and with the other disciplines.
Mathematics can be called the science of models. The concept of model must therefore play a central role in its teaching from the first levels.
The theme of modeling unites all forms of knowledge; this offers numerous and fruitful opportunities for interactions between the teaching of mathematics and that of the other disciplines.
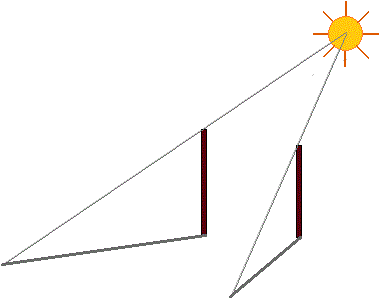
The following figure illustrates the relationship between "model" and "reality". Given a real situation, a model is a simplified representation that illustrates some aspects, for certain purposes. Depending on the purpose there may be different models of the same situation (an airplane model may have the same shape and color as a real airplane but not fly, or it may not resemble a real airplane but fly). The "goodness" of a model depends on its adequacy to the objectives for which it was built (to better highlight some aspects, to generalize some properties, to facilitate comparison with other situations modeled in a similar way, ...). The preliminary phase of the modeling circumscribes the aspects of reality involved in the problem to be studied. In the following diagram, the environment is the part of reality that is isolated, not in detail, in this way, and the situation is the complex of aspects of the phenomenon to be modeled (including assumptions, intuitions, perceptions, intentions, ... of who builds the model) which will be taken into account in the representation:
| model and reality |
|
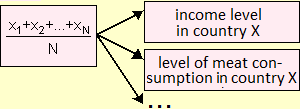
The same model can be used to represent different situations. A very simple example is the concept of arithmetic mean, which can be used to indicate, in a given country, per capita consumption of meat, the average family income, the average height of the twenties, … Another common example is the direct proportionality, which can be used to represent the relationship between the weight of a food product and its cost, between the lengthening of a spring and the weight of the object hanging on it, between the distances among the parts of a car and those among the corresponding parts in a its model, …
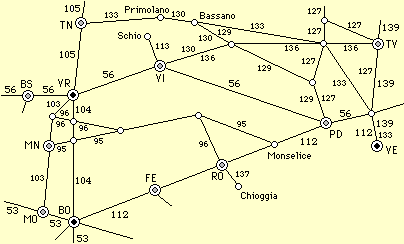
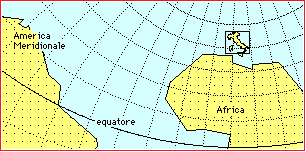
And the same situation,depending on the needs, can be represented with different models. The figure below on the right reproduces part of the graphic index printed on the first pages of a railway timetable: it is a map in which the railway lines are reproduced and the relevant time frames are shown; it is a different model from a usual map in that it does not correctly represent distances and directions.
 |  |
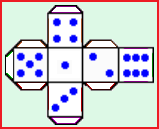
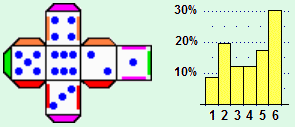
Let's see another, simple, example in which we face a problem with two different mathematical models.
Or I can deal with the problem in a conceptual way: I can hypothesize that the die is perfectly balanced and therefore believe that "1 and 2" have 2/6, or 1/3 as the probability of exit. | 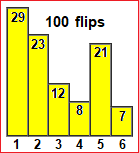 |
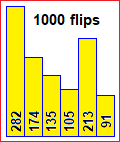 | The "conceptual" model allows me to find an answer quickly, but it is based on the hypothesis that the dice is perfectly balanced (as do not be the made with cardboard dice and not even the usual game dice, in which, for example, the face with "6" weighs less than face with "1"). The "empirical" model, based on experimentation with "my" dice, would allow me, if I had a lot of time, to find a more correct answer (see the figure on the left); but I would need probabilistic tools to evaluate its accuracy. Then there is a relationship between the two models: I use the empirical model to evaluate the adequacy of the conceptual model. In short, the use of mathematics does not consist in brutally applying formulas, but involves "non-mechanical" cultural attitudes; beyond this example, it is also what school must train the pupils to. |
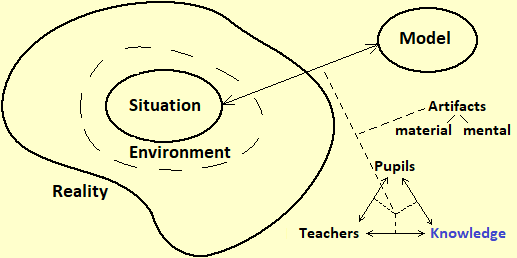
In many cases, as in those now exemplified, it is necessary to reinterpret the model by verifying its adequacy to represent the studied phenomenon and possibly to clarify the situation to be modeled. In the diagram we put a double arrow
The figure examines not only the model-reality relationships but also the "tools" used to build the models and how their development interacts with the educational process, i.e. with pupils, teachers and the whole of knowledge (disciplines, disciplines, techniques, .…).
Models are abstract representations of "real" objects or phenomena (of a material type: a topographic representation is the model of a territory; of a social type: the concepts of "verb", "noun", ... are models for representing certain elements of verbal communication; ... or abstract type: the "commutative property" is a model to describe an aspect of some mathematical operations).
Models are built using cognitive artifacts, i.e. "material objects" (paper, signs, sounds, colors, ...) or ad hoc "artificial constructions" (language, concepts, ...) that man uses as a prosthesis of his mind. The term "cognitive artifact" was introduced by Donald Norman in 1993 (Norman D.A., Things that Make us Smart, Wesley Publishing Company, Addison, 1993), while that of "prosthesis tools" was proposed by Jerome Bruner in 1986 (Bruner J.S., Actual Minds, Possible Worlds, Cambridge, Mass., Harvard University Press, 1986).
The development of cognitive artifacts to model situations does not happen episodicly, but in a social context of cultural growth that is gradually being organized into structured forms of knowledge, which are transmitted from one generation to another through educational processes, in which pupils and teachers interact with each other and with knowledge, the one under construction and the consolidated one. These reciprocal interactions are described by the didactic triangle depicted in the lower right of the initial figure (a reworking of an analogous "triangle" developed by Aristotle to illustrate the "rhetoric", then taken up by Cicero, Quintilian and many others, in similar contexts to that of teaching).
What has been observed so far applies to all disciplines and organized forms of knowledge. But mathematics has the specificity of not being characterized by a particular area of problems or phenomena that seeks to model (such as physics, history, linguistics, ...), but by the type of artifacts it employs for the construction of models, and which are used in all other disciplines. So the graphic diagram seen above (which in itself is a simplification) in order to represent the situation of the teaching of mathematics must at least be enriched with the vertical hatch depicted on the side: the artifacts, for mathematics, soon, from cognitive tools become objects of knowledge, from models that "abstract" from situations become gradually "concrete" tools to develop new abstractions, in a never-ending spiral. Mathematical knowledge, which arises from modeled contexts, is organized internally not on the basis of these, but on the relationships and structural analogies between its artifacts. | 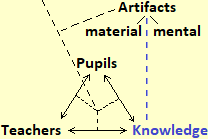 |
The situation, then, becomes more complex as both the "triangle", and the type of "artifacts", with the advent of computer science, have become more articulate: the software has become an "animated" interlocutor that interacts between the different subjects, in ways depending on the use that is made of it and the awareness with which it is used. Without further complicating the previous schematization, it should be borne in mind that the software now has, and will increasingly have, a decisive impact in the way different aspects interact with each other.
In summary, however, we can say that the study of mathematics is articulated in the (non-linear) relationship between posing problems, modeling situations to deal with the solution of problems, building and resorting to theories that internally organize the relationships between the artifacts used for the construction of models and develop new artifacts.
All this makes the role of the teacher crucial in mathematics education. He must:
• design and curate educational pathways that give concreteness to artifacts as they go further away from elementary forms of perception,
• to bring out "reality"-"abstract concept" conflicts (from those between "physical" and "mathematical" mirrors to those between "common" language and "mathematical" language, for example when talking about angles and sides or about rectangles, rhombuses, …, and to the many other conflicts present since the first teaching experiences)
They are conflicts that, if not explicit, risk being sources of misconceptions, while, if faced, they are an opportunity to transform a "destructive opposition" into a "productive dialectic", which contributes to building an adequate image of mathematics as discipline.
• educate to the choice of models (there is no "best" model) depending on the needs and "resources" (physical and conceptual artifacts) available,
• organize teaching so that references to real objects or situations are not only pretexts but also establish virtuous relationships with the extra-curricular knowledge (and motivations) of the pupils, decentralizing, trying to have as a reference not only their own knowledge and motivations but, in a dialectical relationship, also those of the pupils,
• and give organicity to the knowledge they have acquired in the mathematical field (even integrating the study of problematic situations with the development - starting from them - of new concepts and the consolidation of some operational skills through appropriate exercises, which depend on the level of knowledge and technologies historically available) so that they become a solid starting ground for new abstractions,
• all this taking into account that, especially in the first levels of education, the building of virtuous relationships with the extra-school also depends on the involvement of "families": it is necessary to make them participate "culturally" in the educational project that is being carried out (participating "culturally" does not mean "to make the repeaters", but to collaborate with teachers in the construction of relationships between school activities and extracurricular life); this is one of the most difficult tasks; this aspect should also be properly included in the "educational triangle" considered above ...
It is only after the start of the construction of the meaning of mathematics as the science of models that the teacher can gradually construct the meaning of the definitions and demonstrations in the mathematical field, focusing on the differences from the other meanings that in the common language have both definitions (in a dictionary they are based on a bank of words - the defining vocabulary - the meaning of which is not explained) and proofs (the proof of the guilt of a defendant is beyond any "reasonable" doubt, it is not "certain"). We shall come back in many other points both to the definitions (HERE, HERE, HERE, HERE, HERE, HERE) and to the proves (HERE, HERE, HERE, HERE, HERE).
HERE you will find some examples that illustrate the "the limits of the models", including the fact that the identification of a mathematical relationship (statistical, functional, ...) between two real quantities does not always indicate the presence of a cause-effect relationship between of them. These aspects, mentioned earlier (when we observed that the same situation can be represented with different models) and also taken up in subsequent points, are very important to emphasize in teaching.
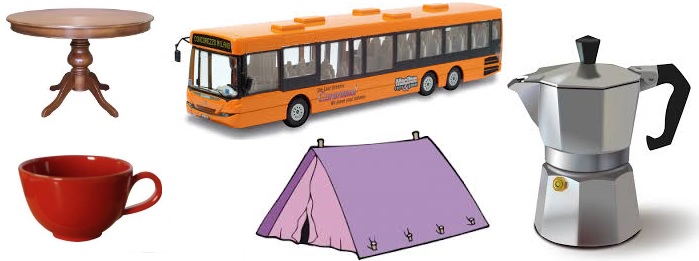
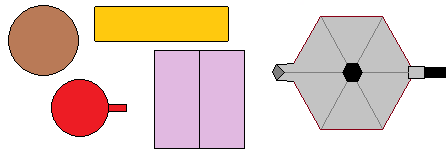
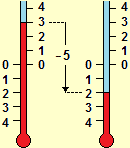
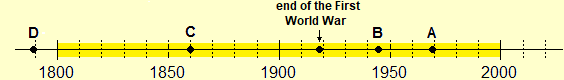
The following images illustrate some (conceptual and practical) aspects of numerical mastery that should have been started in primary school: using numbers to count, to represent and operate with monetary values, to read and represent quantities by using everyday measuring instruments, to read and represent events on the timeline (first up to the age of great-grandparents, then moving back through the years).
 |
 |
 |
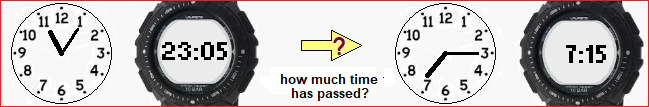
How many minutes are there in a quarter of an hour? And in three quarters of an hour?
In primary school, by referring to the daily uses of numbers, some writing and numerical processing skills should have been developed, the habit of making (implicitly) transference from one context to another to interpret some simple operations (quantitative problems translated into problems on the line of numbers or vice versa) should have been consolidated, as well the habit of operating on divisions by quotition (200/50 is 4 as 50·4 = 200) or by partition (200/4 is 50 as dividing 200 into 2 parts I get 100 and dividing it further into 2 parts I get 50) should have developed, even if the concrete problems faced with them were, respectively, of partition or quotition.
It is essential, at the beginning of secondary school, to set up didactic activities that allow you to • verify operationally this mastery and possibly start activities that allow you to develop and consolidate it and, at the same time, • introduce new methods, topics and reflections that allow you to involve and also motivate pupils that those skills already master (without isolating, therefore, the "remedial activity" from new learning).
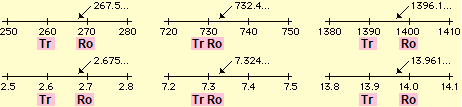
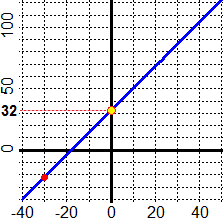
During the lower secondary school, the interpretation of "abstract" numbers as positions on the graduated line must become natural and immediate by the pupils: it is one of the few automatisms (of elaboration, association, passage from a representation to another, ...) that everyone must be able to exercise without mnemonic or reflective efforts (to free mental resources to devote to more conceptual aspects); they are skills/attitudes that should be continuously consolidated/keeeped in shape.
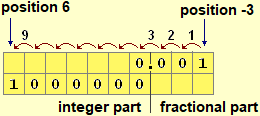
It is also appropriate to make students reflect on the ambiguities with which, in verbal language, numbers with "decimal point" (or "decimal comma") are expressed as well as to point out (eg by observing the menu-options of a computer or mobile phone) the various conventions ("," and ".") which, in the commercial sphere and in daily life, are used on the one hand in Italy, on the other in Anglo-Saxon countries and in the scientific world, to separate the integer part from the fractional part.
| The decimal mark in oral language is often read "and"; for example "1.23" is read "one, point, twenty-three" or "one and twenty-three", as well as "one and twenty-three cents"; in front of "5.03", if you don't add "cents", you have to say "five and zero three", to avoid confusing it with "5.3". In everyday dialogues, different conventions are often used depending on the context in which we find ourselves. For example, when we talk about cars, saying "displacement thousand and three" we do not mean 1003, but 1300, i.e "thousand and three hundred"; in other words we mean "one hundred". Speaking of money, "one euro and three" generally means 1.03 �, i.e. "one euro and three cents", not 1.3 � (that is, "one euro and thirty cents"). |
The reflections on the powers, on the approximate mental calculation, on the line of numbers (and on negative numbers), ... must be intertwined with the revision and consolidation of the concept of "number": see the subsequent comments up to the "descriptive statistics" excluded.
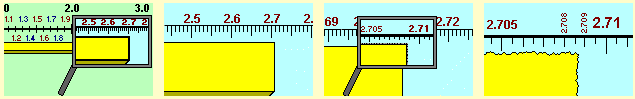
The mastery of limited decimal numbers, the ability to use graduated measuring instruments, ... are fundamental, in particular, to lead informally to the concept of unlimited number (concept which then in upper schools will be called real number). It is certainly not a difficult concept: the Babylonians (about 2 millennia BC) already mastered a positional writing system, albeit with a sixty basis (see HERE): e.g. 1 24 51 10 (written using different symbols for the digits) represented the number 1+24/60+51/60²+10/60³; they knew how to calculate the square root of a number with any precision (they had the idea that it was possible to go on and that stopping at a certain point obtained an approximation, of which they knew how to evaluate the error); … Often school textbooks have gone back several millennia, and with gross errors (see below).
Without a first development of the concept of unlimited number, the use of square roots would make no sense (there would be no number that squares 2), nor, for example, the use of π. Nor would "abstract" geometry exercises, in which the sides or corners have "exact" measurements, or the construction of a continuous line graph, make any sense! It is then necessary, in a simple way, without formalisms, to focus on the fact that exercises are performed with exact measures to simplify life without taking account of approximations, but that in reality there are no objects whose length can be measured exactly (see the animation):
 |
And it is necessary to focus, always without formalisms, that while the lengths of objects do not have the contours precise, in the case of the times we do not have these limitations: the time varies continuously, not in jerks. It is we who cannot measure it exactly.
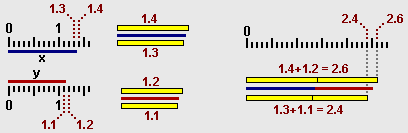
Furthermore, it is necessary to "give an idea" of how sums and products of unlimited decimal numbers can be made, since the pupils have learned only how to operate with limited decimal numbers. The thing is very simple, if it is started with practical activities of sum or difference of lengths or weights. If x has a length between 1.3 and 1.4 centimeters and y has a length between 1.1 and 1.2 centimeters, x + y will have it between 2.4 and 2.6 centimeters:
 |
In a completely analogous way, without strange algorithms, square roots can be calculated, for example.
The introduction of numbers must also intertwine with statistical topics, with reflections on the use of the means of calculation, …
In the most popular textbooks there are serious didactic and conceptual errors. Just think of the introduction of the so-called "absolute numbers" (as well as that of absolute radicals and other nonsense), the introduction of "+" in front of the positive numbers (among which these books do not include natural numbers other than 0), ..., which they are only the result of a gross misunderstanding of the nature of mathematics and of some questions relating to its foundations (if you want, see the following exercise). Or think of the funny (and source of profound misconceptions) introduction of the concept of rational number, which could not be done without an adequate understanding of the concept of irrational number (as are π, √2, 1.21121112… and the overwhelming majority of numbers), and that can be addressed in a culturally significant way only in subsequent school levels (see HERE).
It makes no sense (neither "didactic", nor "cultural") to approach calculation in general using generic numbering bases. The proposals that circulate are, moreover, full of "technical" errors which the authors have probably not even realized. A study of this area of mathematics can be undertaken in high school, and not in the first year, to interpret the "strange" outputs of programs that operate on bases other than the decimal one.
Another thing is to resume and consolidate (in comparision to primary school) the use of numerical notations used in the measure of time (bases 12, 24, 60), on which pupils already have operational skills, gradually acquired over the course of their lives (see figure at the beginning of this item), and from which it is necessary to start by referring, operationally, to the concepts of "ratio" and "change" of measurement units.
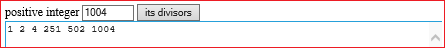
Stereotyped activities on the factorization of positive integers also do not make sense. Instead, it can be significant to practice finding heuristic strategies to decompose commonly used numbers (in order, for example, to simplify relationships) and, in case, control the results with simple online programs, such as this:
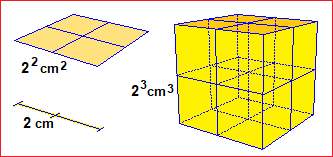
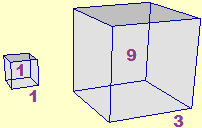
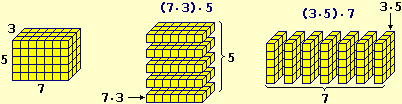
In primary school the use of powers is started in relation to the measurement of areas and volumes: it is learned, operationally, that in 1 decimeter there are exactly 10 centimeters, that in 1 cubic decimeter there are exactly 1000 cubic centimeters, that (not at random) 1 cubic centimeter is 1 milliliter, being 1 liter equal to 1 cubic decimeter. In lower secondary school the writing of powers is consolidated (instead of 1000 you learn to write also 10³) and we extend to considerations on powers with other bases, referring initially to areas and volumes but quickly passing to the use of exponential notation, fundamental to master the use of the means of calculation. These are very important concepts and skills for other scientific subjects too.
On the other hand, activities with powers (if they are not immediately reduced to the mechanical application of rules) can help to consolidate the meaning of negative numbers and additions with them. E.g. this is possible if in the explanation or correction of errors in calculations such as that of
Mastery of exponentiation is fundamental in the most varied fields of mathematics. It must be consolidated operationally not through activities detached from contexts, but in relation to situations of use in which the powers intervene significantly and which can constitute solid points of reference for the conceptualization and memorization.
Recall that in many books the following definition is widespread: "an is the result of n multiplications of a by itself", which is obviously wrong (if we start from a instead of 1 the multiplications for a are
| As already noted, it is important to immediately introduce the use of exponential notation and focus on its usefulness, together with the consolidation of the use of different units of measurement and of the positional writing and with the education in the use of pocket calculators and with a start to the mental development of the approximate calculations. | |
| In addition to the convenience of exponential notation for describing large and small numbers, it is good to highlight the fact that it facilitates syntactic and semantic control over what is written, that using it to introduce numbers with orders of magnitude large or small on a calculator makes it more difficult to make typos (e.g. forget some zeros), that it allows an unambiguous description of the approximations. The latter observation can be developed explicitly when, in subsequent school levels, a more systematic study of "numbers" will be tackled. | 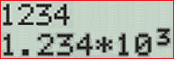 |
| The "statistical" themes offer many opportunities to naturally insert the first activities and reflections on the use of exponential notation and the use of powers. | |
Obviously, in the activities mentioned above, the meaning of the 4 operations must be resumed and consolidated (relationships between them, situations of which they are models, geometric interpretation, .…). It is useful, in particular, to discuss their mental calculation strategies with pupils, questioning them if incorrect, proposing alternatives, … but without setting the objective of imposing on them procedures other than those they employ, if correct: different people can, for various reasons, prefer to follow different types of reasoning.
If it is of use, it is good to resume the basic elements of the 4 operations techniques, recovering mental and non-mental calculation skills, often obscured by "fast" (and "volatile") techniques on which the pupils were trained in the previous school levels (see HERE to get an idea of how "calculation techniques" should have been introduced in primary school and, in case, resumed at the beginning of secondary school).
It is also necessary to keep in mind the possible presence of pupils with dyscalculic disorders. Dyscalculia is present in about 2% of the population, therefore in a class of 25 pupils in basic school there is about 50% probability of having a pupil with a pupil with such problems; the probability of having two is much lower, around 25%; of having three is about 10%. A primary school teacher during his career should meet about 5 pupils with dyscalculic disorders (often, due to the incompetence of those who make these diagnoses, situations that do not fall within this area are reported as dyscalculic cases). A lower secondary school teacher might meet about ten. What to do in these situations? First of all, it should be noted that dyscalculia occurs in pupils with normal intelligence and without neurological disorders. It is therefore necessary, starting from the basic school, as with the other pupils, to refer to all the real life situations in which numbers are used, to refer to algorithms in which the meaning of the procedure is transparent and, in particular with them, to rely immediately on technological aids for carrying out the calculation activities, initially limiting their use by other pupils.
You can use the usual calculators or calculators present in the software, such as those that can be accessed from HERE; you can use the Google "translator" (see HERE) where you can write numbers and operations (such as: 7.5 1500 12% 5000000 3/4) and listen to their reading; you can also (as suggested by the international website dealing with dyscalculia) use WolframAlpha (see HERE, then click on Elementary Mathematics, Arithmetic).
Dyscalculic difficulties are largely related to memorization problems (similar in some respects to similar difficulties that can occur in some people following accidents or small strokes) that do not compromise the understanding of mathematical activities if you rely on the use of the computer,, as can be done for several decades now. Obviously, teachers should stimulate these pupils, from the early years of school, to use the means of calculation suitably.
A similar in many ways (and slightly more frequent, about twice the dyscalculia) disorder is dyslexia, i.e. the difficulty in reading and sometimes writing words, which usually occurs with the transposition and inversion of groups of letters. The use of the computer is obviously also of great help in facing the problems it generates. You can resort (similarly to what was said for dyscalculia) to Google, to free writing programs (such as OpenOffice, LibreOffice, ...) and to their spellcheckers (which offer alternatives to what has been typed). The same typing of texts on the computer, and the observation of what is being written, and the possibility of correcting what is written, is in itself helpful for those who have problems of this kind.
The activities on the line of numbers, in particular those involving negative numbers, are very useful for consolidating (also through the repetition of similar exercises) the habit of leaning on the (mental image of the) line of numbers. It is important to introduce negative numbers correctly, not to use rules (harbingers of misconceptions) such as "−" by "−" make "+", not to put the "+" sign in front of positive numbers, ...; frequent errors resulting from these misconceptions are, for example, that of transforming
In many textbooks, in Italy but also abroad, serious and absurd errors are found, such as that of considering √4 equal to ± 2.
It is useful: • to interpret the errors or difficulties of (written or mental) numerical calculation of the pupils, • to make its origins explicit, • to get them do checks on the properties erroneously used (or those not used) in simple cases, • to resort to geometric interpretative models for generalize numerical examples, such as the following (the first illustrates a usable property, the second an error):
 |
Operations with negative numbers are easily understandable, if introduced by interpreting the "negation" as a reversal of direction. For example, in the case of the formula |
 |
Arithmetic operations are the first numerical functions with which one has to do in school life. We will come back to this later.
Still some reflections, introduced by the following example:
|
This is how a normal person would approach this calculation, and the way the school should educate pupils. But, unfortunately, often, in the textbooks there are absurd treatments that either proceed by transforming all the terms into fractions (3/4 + 15/2 + 1/4 …), and then use rules for fractional calculation, or transform them all in decimal form (0.75 + 7.5 + 0.25 …) and then operate with the standard additive algorithm, in both cases taking "school" mathematics away from the mathematics used in life and scientific activity.
The concepts of ratio and proportionality
The concepts of ratio and proportionality are gradually built up within each mathematization activity; we have already seen it in the items considered in the previous paragraphs: • when employing different units of measurement, • when referring to the use of the clock, when using the scales, • when making a graph that links two phenomena and has a linear trend , • when making calculations in which numbers appear both in decimal and in fractional form, ...; and then we will see them again when we considere statistics and probability. Concepts are built in contexts in which they intertwine with each other; then gradually the school should highlight differences and analogous relationships between them.
Towards the end of 1st grade secondary school the mastery of these concepts (together with that of inverse proportionality - see "inverse proportionality below) should have become a solid point of reference also for the acquisition of the use and meaning of the functions and equations in the representation of relationships between quantities, for the use and construction of algorithms, ..., in view of the developments to be addressed in the upper secondary school.
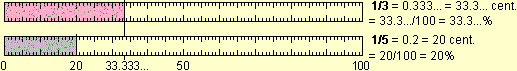
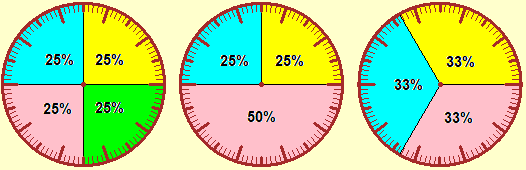
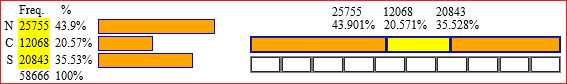
We emphasize the importance that pupils gradually acquire the ability to "spontaneously" switch from one form of representation to another of the most common use ratios (0.75, 3/4, 75%; 0.125, 1/8, 12.5 %; 15/60, 1/4, 25%; 2/3, 40/60, 0.666 ..., 67%; ...), also through repetitive exercises that consolidate in them the various graphic representations (strip, diagrams and circular sector diagrams, variously graduated; straight lines passing through the origin). And it is important that they master the equivalence between division by quotition and by partition (see above) to immediately realize, for example, that 1/0.1 is 10 since 0.1 is 10 times in 1, that they develop/consolidate the idea that the reciprocal of the reciprocal of a number is the same number and that which "multiplying by 1/k" is equivalent to "dividing by k" (both ways to express the inverse function of "multiply by k"). It is, however, completely counterproductive to invest in the development of the mechanical calculation of the sum of fractions (see here).
It is fundamental that pupils consolidate the idea that "%" stands for "/100", that they learn to express percentage variations as multiplications (increase of 10% as multiplication by 1+10/100 = 1.1, decrease of 20% as multiplication by 0.8) and to set the calculations in this way with the calculators: this is important to focus on the fact that the composition of two successive percentage variations is not obtained by making the sum of them.
10% increase 20% increase x ————————————> x�(1+10/100) ————————————> x�(1+10/100)�(1+20/100) = x�1.1�1.2 = x�1.32 |
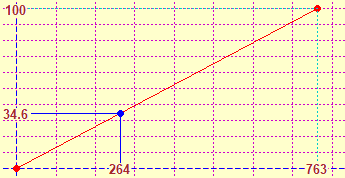
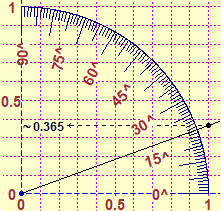
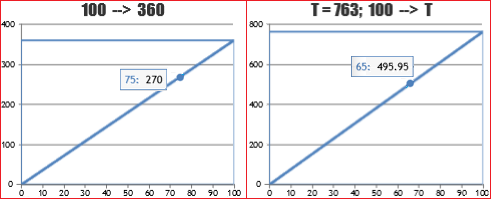
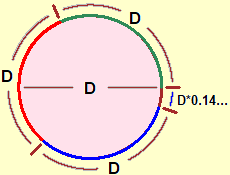
It is also a very natural context for the consolidation of the first formulae manipulation activities. We underline the inopportunity to resort to specific resolution techniques for proportions (instead of considering them "equations" like the others) to deal with proportionality problems. For example, to express the ratio between 264 and 763 (data referring to some context) in percentage form we can resort to graphic representations (first on graph paper then, in case, also using software - see the figure below left) and, afterwards, to the calculation of the division (and its two or three-digit approximations). In particular, it should be pointed out that the symbol ":" (which appears on maps and in various other proportionality situations) is simply the symbol of division, and that this can also be expressed with "/", and that, for example, to find the angle to express 264 if 763 is represented with the whole circle (after learning how to do it by calculating the corresponding percentage and then, as seen in the previous figures, using a circle divided into 100 parts) you can use the manipulation reproduced below on the right (without resorting to strange rules, such as "product of means = product of extremes"), which exploits only the relationship between division and multiplication.
 |
    angle   264              264
    ————— = ———  —>  angle = ————·360
360 763 763 |
The concept of fraction should be presented as a particular case of ratio: this allows the different aspects with which fractions appear in applications to be well intertwined. It is necessary to focus gradually on how to compare relationships, how to determine the reciprocal of a relationship and, then, how to use distributive property (see formulas, terms, graphs).
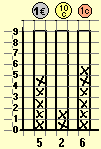
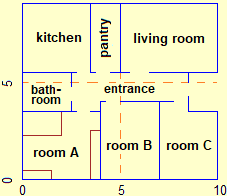
The contexts in which the concept of ratio is used are innumerable. The following figures recall other ones in addition to those previously considered (the capacity measurements, the transmission ratios of a bicycle, the scale plan of an apartment) from which you can start to introduce or consolidate different aspects.
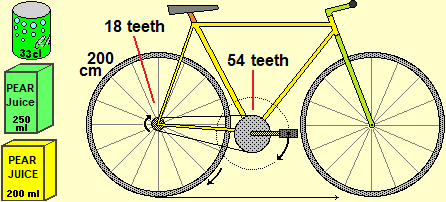
The "circles" come into play not only to focus or consolidate the concept of "part out of total" ratio, but also to introduce the concept of slope, which will then be dealt with in high school also using the "tangent of an angle" function. The following figures illustrate various of the activities that can be carried out: interpret the meaning of a road sign, focus that 100% slope does not mean verticality (but a situation in which the run and the rise are equivalent), read a map with the indication of the level curves and the slopes of the climbs, how to measure the height of a tower or a mountain with a vertical protractor, and the connections with the use of the compass (the latter are activities that are effectively intertwined also with the experiences of scouting).
slope = 5/10 = 50% 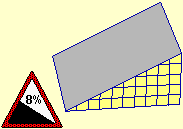 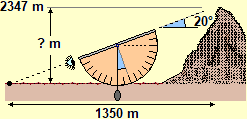 |
 ? = 1350·0.365 ≈ 490 |
 |
The context of proportional representations also offers simple and significant opportunities to educate the use of IT tools for the automation of some calculation procedures.
As it should happen for the introduction of all mathematical models, it is good that even in the case of the concepts discussed here, not only the advantages of their use are highlighted, but also the limits; for example, we should highlight the information that is lost if we compare percentages instead of absolute data: if 100 years ago the percentage of household expenditure on food was much greater than today, this does not mean that at that time we spent on food more than in our days.
The use of the various graphical representations (line of numbers, graphs, tree graphs, histograms, schemes, ...) greatly facilitates the reasoning, the framing of the problems, the research and conjecture of solution strategies, the exploration of connections , relationships or regularities, the display of large quantities of information, the development of models that allow easy passage between context and concepts with which it is mathematized, ...
This is also the way in which mathematical elaborations (related to sociological investigations, economic situations, technical-scientific phenomena, ...) are generally communicated to us by the mass media.
Graphical representations are increasingly present in the various sectors of mathematics. And many of the more abstract concepts are born as generalizations of spatial concepts, of which they carry traces, metaphorically, in their name (spaces of infinite dimensions, measures of abstract sets, ... and points, coordinates, diameters, projections, orthogonality, .. . referring to objects that we cannot physically represent).
It is therefore fundamental that the teaching educates the use of the graphic representations (both to model situations and to carry out theoretical considerations), to the transference between them and other forms of representation, to the intertwining of graphic methods and symbolic and numerical methods, … It is appropriate that, gradually, interweaving with considerations of statistics and geometry and with the analysis of various phenomena, the main forms of graphic representation are introduced (highlighting their potential, limits and interpretative problems - see, on the right, different representations of the thousands of unemployed over the years). Specific insights on the Cartesian plane and on the curves can be started at the end of the lower secondary school, with a view to taking them up more systematically in the upper one. | 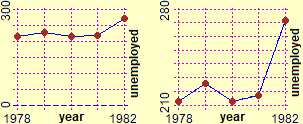 |
The computer is an extraordinary tool that facilitates the construction (and reading) of many types of graphic representations. There is a lot of free software that can help in this regard. However, it is important that pupils first of all learn to draw graphs by hand, starting from both data and algebraic representations, which acquire the ability to imagine graphs, to describe them in words, ..., as well as to graphically schematize simple problems, to represent with graphs terms in which 2 or 3 operations are present, to associate graphs with phenomena, ...
The topic "approximations" must be introduced gradually within all the didactic activities that arise, without a apart treatment, since according to the contexts there are various ways in which it presents itself: reading and interpreting approximate data that they are found on articles, on television, …; knowing how to read measurements with various tools; understand the difference between rounding and truncation approximations and the different ways to work with them; approximate the results of various operations and procedures obtained with a calculation medium (on this aspect see also calculators, computer, logic), …
The theme must subsequently be taken up in the upper secondary school, connected to more general mathematical themes (the approximations of curves, the approximations of probabilistic calculations carried out by means of statistical simulations, ...), as well as to physical themes (to get an idea of the connections with physics that can be developed see HERE).
We recall the current meanings of truncation, rounding and significant figures:
| |||||||||
The concepts of rounding and significant digits are also used in a broader sense; pupils must be educated to pay attention to the context. For example, it can happen to read that a certain value is around 1850 to mean that it is rounded to the nearest fifty (the original value was 1867). This is the use that is often made in newspapers or on television, to facilitate communication.
It is important to emphasize to the pupils the advantage to make roundings only at the end. It is, however, a habit to be consolidated through practice (and the reasoned use of the means of calculation, right from primary school). At one time (until about 1970) when proceeding with manual calculation, it was more convenient to operate on rounding of intermediate results, even if the precision of the result was worsened. Such things, however, half a century later, are still found in many manuals of both physics and mathematics.
As already mentioned in previous entries, the approximations are also useful for quickly making (without calculator, by hand or in mind) calculations of which we are not interested in the exact result, but only an estimate of it. Here are a couple of examples of approximate calculation performed by rounding the numbers to 1 or 2 significant digits and performing the calculations on the rounded values:
|
It is opportune, from basic school, to make extensive use of pocket calculators. It may be useful for the teacher to review the models available to the pupils (for example he can ask the pupils to draw the keyboard of their calculator on a sheet). It is also appropriate to invite the pupils to read the user manual of their calculator (initially excluding the keys for more complex functions). We remind that the use of calculators is indispensable if there are pupils with dyscalculic difficulties, as mentioned in the item elementary arithmetic.
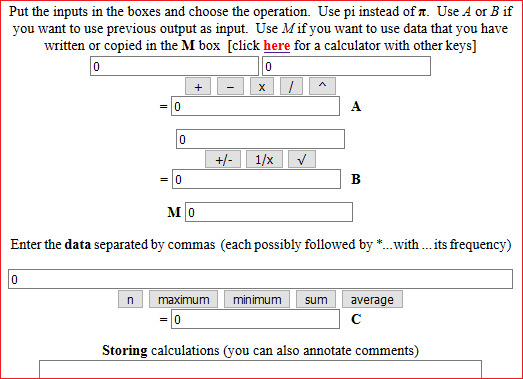
The objectives should be eiher to acquire a greater mastery of this means of calculation, to understand its limits in order to interpret the results it provides, …, or to introduce and/or consolidate (at a first level) some mathematical knowledge: numbers (approximations, …), on operations (properties, priorities, …), on functions (1 input and 1 output functions, such as
 ,
,  , …, 2 inputs and 1 output, such as
 ,
,  ,
,  ,
,  ,
,
 , …, 2 inputs and 2 outputs, such as
 , …, and composition of functions, inverse functions, …), …, or to prepare the ground for understanding the functioning of computers (which, as mathematical knowledges and arithmetic calculation possibilities. do not differ "essentially" from a pocket calculator, where we have the possibility to operate with the keys
  ,
,  ,
,  , …).
, …).
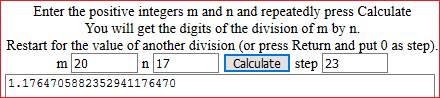
It is evident that the use of the means of calculation is to be introduced at the same time as the treatment of the other mathematical themes, albeit with specific insights. Examples of activities in this direction can be suggested by the exercises present HERE (and in the following pages), in which the theme is enlarged to that of the description of the algorithms and to the description and reflection of various aspects of the automation processes. It is a theme to which (given the centrality it has assumed in the free time and normal work of almost all people) a relatively autonomous space must also be given in the lower secondary school, historicizing it, not only by exemplifying its current use in the various contexts disciplinary, as we also discussed here reflecting on the teaching of the various mathematical fields. Some examples of various types of software can be found HERE. Two examples below, "division" and "pocket calculator".
 |  |
 |
Introducing the use of the software also involves discussing the analogies and differences between formal and artificial languages. A related aspect is the discussion of which aspects of the Logic theme can be addressed at school level; this theme can only be understood in a broad sense, as education for attention to linguistic aspects, to understandable presentation of arguments, …. It is worth mentioning that even demonstrations cannot be included in a specific area of learning: they are widespread in all areas of mathematics, and demonstration techniques (and the ways in which the mathematical propositions to be demonstrated are expressed) are very numerous, not enclosed in some stereotyped examples, as often happens in textbooks (a reflection on what the demonstrations are can be found HERE; some examples of activities on the area of logic and demonstrations can be found HERE, and in the following pages).
We will return to the importance of linguistic aspects later on by discussing formulas, terms, graphs; there, in the third image, we also see the passage from 3 5 9 
Note. If the teacher wants, he can put graphics on the net made with a simple script and that pupils can freely resize with the mouse (see HERE):

| Descriptive statistics (to which we have mentioned several times discussing the previous topics, and in particular the concepts of ratio and proportionality) lend itself to the introduction in significant contexts of many basic mathematical concepts, from numbers to approximations, from the concept of function to the construction and use of formulas, from graphic representations of numerical relationships to the reading and development of algorithm. This, at least, if the statistics - which more than 20 thousand years ago constituted the first mathematization activity of man (the use of marks cut into bones and other artifacts to compare quantity of days, objects, people, ...) and can be addressed even in nursery school - is not reduced to being an additional theme to be taught separately from the other themes. The descriptive statistics tools then serve as points of reference for the subsequent introduction to probability. HERE are links to programs that can be used for statistical processing. | 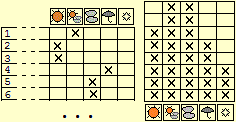 |
Let's do some flashes to better focus the interaction of statistics with other mathematical concepts.
|
On the left, the feasible representation on squared paper of the following data: ← weights (rounded to kg) of a group of male pupils of the last year of an upper secondary school [64, 66, 73, 86, 70, 75, 68, 86, 88, 63, 73, 70, 69, 66, 77, 80, 80, 77, 82, 61, 77, 71, 59, 84, 86, 70, 77, 70, 97, 68, 66, 70, 70, 68, 70, 68, 81, 73, 61, 73, 59, 70, 68, 67, 70, 68, 64, 82, 86, 66, 68, 74, 64, 64, 62, 56, 70] It is a simple extension of the histograms with crosses that allows you to keep all the numerical information on the data, to identify the median (the value at the center of the ordered list of data). The computer is not needed to make these representations: just a pencil and a sheet of squared paper are enough. |
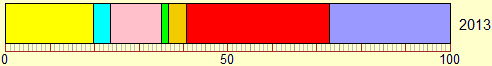
The following images remind the use of bar charts, areograms and strip diagrams to represent classifications in generic classes, not in numerical ranges. They are different mathematical models of the same phenomenon (achievable on graph paper and circles graduated in hundredths, and then with software), quantifiable with percentages, which visually communicate different information (the first models allow you to quickly compare, both visually that numerical, the different percentage frequencies; the seconds to understand what relationship there is between the various parts and the total; the thirds to compare similar situations referring to different periods or to different countries or ...: I could put under the strip diagram shown that referred to 50 years earlier).
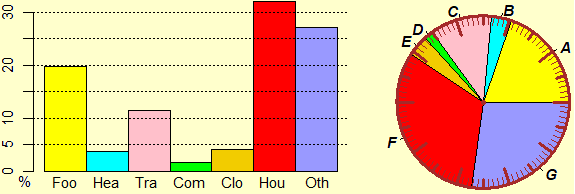
Liguria -
Food Healthcare Transport Communication Clothing Housing Other
After learning to operate "by hand", before using general use software, you can also resort to online scripts, like this or this:
Graduated circles can be found HERE. For graduated scales in 100th, 180th, 360th see HERE.

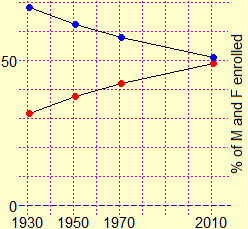
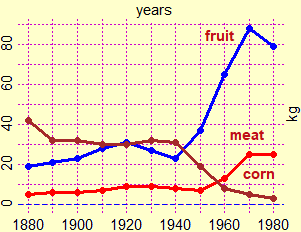
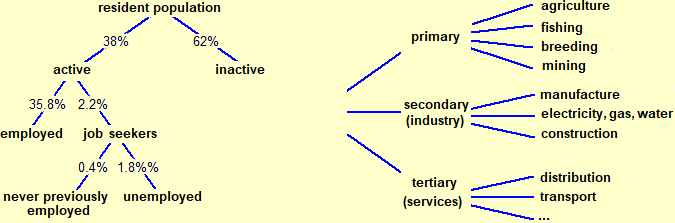
The examples we are seeing highlight another aspect. Statistics must inevitably refer to non-mathematical contexts, and is therefore a stimulus (for pupils and teachers) to interact with other disciplines, as well as between the different areas of mathematics, as the following examples also highlight: the graphs over time of a percentage distribution (boys and girls enrolled in high schools in Italy in various years) and of the average values of some quantities (the kilograms of beef, fresh fruit and maize consumed on average by an Italian).
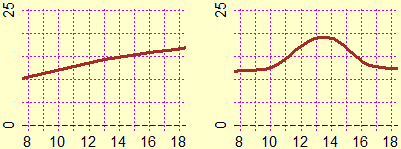
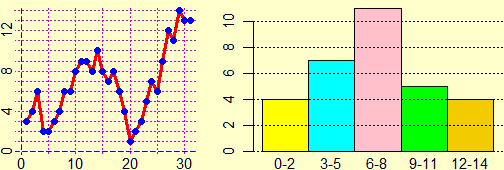
Statistics also allow us to focus well on how, depending on what interests us, different mathematical models can be considered for the same phenomenon, highlighting or neglecting different aspects, as we have already observed above. Here, for example, are two alternative graphical representations of the thermal regime in a certain month of a certain location: the first model allows to reconstruct the temporal trend; the second loses history but highlights the distribution of temperatures and allows you to compare it with that of other months or locations. There is no best model.
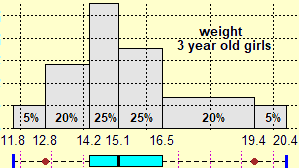
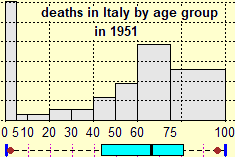
And then it is appropriate to focus that in a histogram (like the ones below, one referring to the weight of 3-year-old American girls, the other to the dead in Italy in 1951 by age group) the frequencies of the various classes are represented by the areas of the various rectangles, not from their heights! This aspect will be important, afterwards, to face in the following school levels (without misconceptions) the study of continuous random variables using integration (if the distribution is represented by a curve, the probability that the exit is between A and B is l area underlying the graph between abscissas A and B). In lower secondary school, it is possible just to observe and read histograms of this type, in case also the diagrams below, in which the "box" represents the central 50% of the data and gives a representation of their dispersion (it is possible to use software that tracks them automatically).
 |
 |
We mention a couple of important observations to face with the pupils. The first is that the sum of three or more approximate percentage frequencies does not necessarily mean 100: if I have a total of 150 divided into three parts each equal to 50, the percentage frequency of each of them is 33% or 33.3% or …; their sum is not 100. The second is that there are several concepts of "average" besides the arithmetic mean. In addition to the very important role of the median, already mentioned, it is important to focus on that the average speed is not obtained by doing the arithmetic average of several speeds.
On the problems relating to the introduction of the concept of average we refer to the considerations made regarding primary school and to the developments present here.
The contexts to which statistical surveys can refer are innumerable. However, it is appropriate to refer also to issues close to the cognitive (and psychological) needs of children of this age group (such as society, body development, school, …).
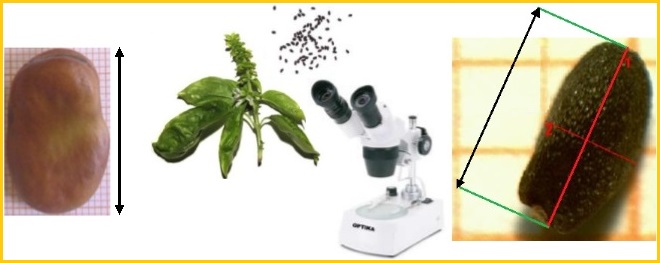
Many statistical activities can also be carried out in the field of science teaching (as well as in that of other disciplines). Below some images that recall investigations carried out by some classes on the size of bean and basil seeds.
We have talked about variables, constants, terms several times by discussing the previous items (in particular the concept of model and elementary arithmetic items) and we will talk about them in the following items, starting from the next one. They are basic concepts and linguistic aspects (related to the writing, interpretation and modification of the formulas), to which it is necessary to give, at a certain point, a first arrangement, and in a decidedly different way from the "funny" way of starting the algebraic calculation often used in textbooks: disconnection from the use of these objects to represent and solve equations; introduction of strange things called "polynomials", which are not, while polynomials can be introduced in a significant way only in secondary school - see what has been discussed for this school level QUI; ...
We remember the importance of recall from primary school and consolidating (or introducing) the use of "tree graphs", important for learning the meaning of formulas, learning to switch from one language to another, reading formulas not only as symbol sequences, consolidating the first conventions in the writing of terms, ... and for describing procedures that cannot be easily described as formulas, solving problems, ...
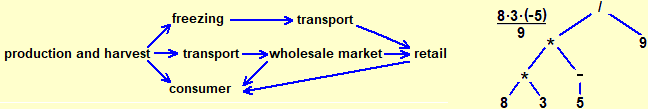
On the other hand, they are used in various other disciplines: the image below on the left recalls a typical use. The image on the right recalls a particular use in mathematics (some deepenings on this use can be found here), important for focusing on the structure of the terms, to which we will return shortly (it is a representation of the calculation that can be performed using a calculator with
3 5 9
The following images illustrate other typical examples made in other areas, but which have strong intertwining with mathematical education: the division into percentage parts, the division of a class into subclasses (to be tackled in an operative way, not with abstract reflections on the "sets").
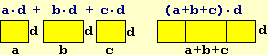
We need to focus resolutely on the analysis of the structure of terms, thinking that difficulties related to this aspect are at the origin of many of the most common mistakes of pupils. Besides, pupils must be encouraged to identify, explicate and control the transformation processes as indicated in the various passages. The aim is not to list and demonstrate to the pupils all the processes of algebraic transformation, but to consolidate, through transfers between the various areas of mathematics, through images and practices, the possibility of rearranging the terms of a sum or a product (which would be very difficult to demonstrate starting from properties such as "associative" and "commutative" - see here if you are interested in an in-depth study at an adult level), the possibility of collecting as a common factor, …
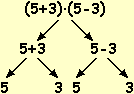
It is also important to note gradually that graphic methods allow you to anticipate, and then motivate, algebraic techniques (as already discussed when talking about "ratio and proportionality"). An example:
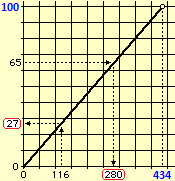 |
Which "percentage" of 434 is 116?
        dat            65    dat
   65 = ———— ·100  →   ——— = ————  →
        434            100    434
    65                       65·434
   ——— ·434 = dat  →  dat = —————— = 282.1
   100                        100
|
For some historical and didactic considerations on the use of formulas and on elementary algebra see HERE, where some coarse errors often present in the definitions found in school books are also commented.
For some reflections on the "=" symbol and its different uses in mathematics must also find space in teaching, to avoid or overcome misconceptions. See HERE for some examples and some didactic considerations.
We observe that some textbooks speak of arithmetic roots. It is a strange concept that has little to do with the concept that, at one time, was used to identify with this term, to distinguish it from algebraic roots: with the first it was indicated that it is simply called "root", with the second it was indicated the set of solutions of an equation (with unknown x) of the type xn = k; e.g. in the case of x2=4 we would have {−2,2}. In these books the root of nonnegative numbers is called arithmetic root. So
The concepts of function and resolution of an equation
The concepts of function and equation are perhaps the most important concepts of mathematics; they intertwine with almost all the other voices discussed here. They are present in programs of all school levels. The first functions that the children explicitly meet are, at the beginning of primary school, the four operations (two inputs), the unit increase, the unit decrease and the change of sign (one input). But in primary school they also encounter functions with any quantity of input, such as the maximum and minimum of a set of data, and functions to which a calculation procedure does not correspond (for example the height or weight of a person, or the population of a city, as a function of time; or tariffs of various kinds, in which the monetary value is expressed as a function of various quantities). They also meet with multi-output functions (division with remainder, for example, is a two-input and two-output function).

On the other hand, even the histograms with crosses (which can be introduced before elementary school, in kindergarten, like those present HERE) are functions: every way of getting to school is associated with the number (represented by a column of crosses ) of the pupils who use it; each type of holiday resort is associated with the number of pupils who spent it that way; each weather condition is associated with the number of days of the month in which the weather was such; …
It is evident that these concepts have little to do with the definitions with which they are introduced in many textbooks: a function is a set of ordered pairs such that …; the authors of these books have picked up definitions like this that are done in university algebra courses, without realizing that in order to master them one must have techniques, not at all simple, to represent an input sequence and an output sequence with a suitable pair of mathematical objects. Besides in many books an absurd distinction is made between empirical and mathematical functions, by authors who evidently have not understood what mathematics is (see HERE).
Recall that the name "operation" is an appellation used to indicate some functions, generally with 1 or 2 inputs, but not only. There is no "definition" of the concept of operation. And even on calculators all the keys to perform calculations with 1, 2 or more inputs are called "function keys".
The simplest and "cleanest" way to introduce a first "definition" of function is exactly to refer to graphic images such as those presented at the beginning of this paragraph and to the idea of "calculation tool": functions are ways to associate inputs to outputs. Then, in later school levels, this concept can be better focused.
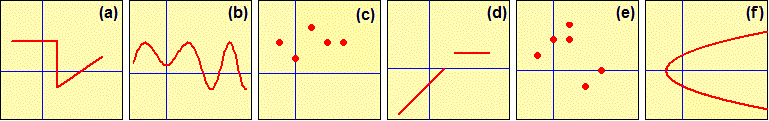
Then, for the 1 numeric input and 1 numeric output functions, the related graphs can be considered. Or better still, often, as we have also seen in the previous entries, functions can be presented directly in graphic form.
|
After the examples of use, the concept of function can be verified/consolidated with simple, but significant, exercises too, such as the following:
|
|
It is good to indicate the variables in various ways, as happens in everyday life. These uses must then be followed gradually by exercise and abstract consolidation, which, at the end of lower secondary school, can also be done on variables with names that are independent of the various application contexts. In particular, it is suitable to learn how to describe the functions shown here on the right with the formulas And it is good to realize immediately that a formula can be transformed by expressing a variable as a function of others in different ways, depending on the needs. It is also essential to refer, in a non-formalized way, to the concept of inverse function, as a tool for disassembling / transforming equations. |
 |
|
"How much pasta do I have to produce to have a unit cost of about �2?", "Which side must have a cube to have a volume of 0.7 liters?" are "equations" that I can also solve using the previous graphs. But some equations (even without calling them explicitly in this way) are solved from the beginning of primary school: the divisions by quotition (600/200 intended as "how many times do I have to take 200 to get 600") are evident equations (which, on an adult level, indicating the unknown with x, we would write as 200·x = 600). Some other examples:
| ||||||||||
|
| ||||||||
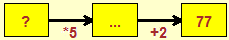
In previous entries we have seen many examples of solving equations. Let's see how far it is possible get, in the lower secondary school, in order to create favourable condition for activities that will have to be consolidated in subsequent school levels. For example, let us consider the problem "how much pasta do I have to produce to have a unit cost of about �2?" (which, just above, we said can be solved in an approximate way graphically) if the unit cost to produce x kilos of pasta is 1+32000/x:
| (1) | 1 + 32000/x = 2 |  initial equation initial equation |
| (2) | 1 + 32000/x −1 = 2 −1 | I applied "–1" |
| (3) | 32000/x = 1 | "1" e "−1" cancelled each other out; 2−1 = 1 |
| (4) | 32000 = x | I applied "·x" and made the calculations |
It is important that the various steps are carried out on separate lines, without abbreviations, explaining step by step what has been done. The pupils must not be educated to transport everything from one side to the other: when I reach 32000 = x I have the solution, I don't have to make strange shifts here or there with magic recipes. It is also important that the pupils understand that, in cases like this, they can solve the equation graphically with zooms, possibly downloading the calculations on a "black box" program (but whose operating logic they have understood: it automates procedures that before we carried out "by hand" - see for example here), and that the latter procedure can be used to solve even more complicated equations, which they will see how to deal with symbolic methods in secondary school.
For some years now, we have passed 2000; the amount of mathematics that is used, and the way in which it is used, grows and evolves rapidly: it makes no sense to teach how it was done in 1900, 70 before the new technologies spread! It is necessary to think, in teaching, what to keep, what to change, what to throw away.
|
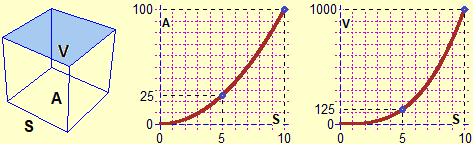
In particular, as already mentioned, it is important that pupils consolidate the "concept" of function (not that they memorize a possible "definition" of function) by referring to various ways of expressing or representing it (numeric, graphical, algebraic, in words, …), and gradually strengthening, and when possible, the intertwining of these ways. It is essential that pupils take up the meaning of square root (which must be defined from the beginning by referring to real numbers, intended and introduced as decimal numbers). And, obviously, they have to reflect on the fact (and see graphically) that the "square root" function and the "squaring" function are the inverse of each other, if you narrow to |
; 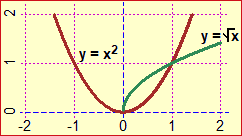 |
A reflection on the general lines of geometric teaching in the lower secondary school should be addressed starting from some general consideration on geometric teaching, which we can entrust to this "digression", fantastic but very concrete, on the concept of angle.
It contains various reflections on the inopportunity of an axiomatic approach to the teaching of geometry. This approach was set up only at the end of the nineteenth century, especially with the aim of focusing on the different geometries that could be defined by changing some axioms. The so-called "Euclid's Elements" (not to be confused with "Euclidean geometry") are significant in the history of thought but certainly do not have the characteristics of what, in mathematics, is an axiomatic presentation: HERE it is highlighted that also the demonstrations of Euclid's first "theorems" are not acceptable.
The objectives of teaching in the lower secondary school (and which should be privileged in the initial tests and in the remedial actities at the beginning of the upper secondary school) should be more those of "cognitive attitude" and ability to "operate" consciously with the basic knowledge to solve problems. For example, referring to aspects already considered in the previous paragraphs (and to the reflections and examples examined in the document mentioned at the beginning of this paragraph):
(a) knowing how to use measuring instruments (ruler, protractor, graduated cylinder, balance, …) to determine extensions (directly or by measuring other physical quantities with which proportionality bonds exist), knowing how to calculate the area of some "strange" figure by using checks or by triangulation, knowing how to compare (with the naked eye) the amplitude of drawn angles (regardless of the size of the segments with which the sides were represented), knowing how to associate the corresponding precision with a measurement, having an idea that the accuracy of direct measurements affects the precision of indirect measurements, … rather than knowing how to recite formulas (direct and inverse) for the calculation of areas of standard figures, being trained to solve stereotyped problems with cones superimposed on cubes, …;
(b) knowing how to use drawing tools (drawing perpendiculars and parallels lines using square and ruler, ...), knowing how to organize the "worksheet" (from the problem of choosing the units on the axes to the problem of where and which figures to draw first to obtain a certain composed figure), knowing how to schematize concrete situations with abstract figures, knowing how to pass from a verbal description of a figure to its drawing and vice versa, … rather than repeating definitions and being able to easily identify figures or elements of figures arranged in "standard" ways;
(c) knowing how to build/interpret scale reproductions (using equations, not with the notorious ad hoc rules for proportions), knowing how to calculate inaccessible distances using similarities, knowing how to associate shadows with objects and other transformed figures to the original ones, … rather than knowing the terms "affine transformations"," homotheties", …
(d) having reflected (not generically) on the differences between common language and specialized languages, having carried out (in simple, but not trivial) contexts some experimentation-conjecture-verification-demonstration activities, being familiar with leading back a problem to other problems (leading back geometric problems to other geometric problems – some of the activities considered in (a) are examples in this sense – creating or interpreting graphic representations of relations between quantities, geometrically visualizing algebraic properties, ...), ... rather than having learned to repeat things like "the point is the geometric entity without dimensions", "we must not speak of equal triangles but congruent triangles because in mathematics two objects are equal only if they are the same", ...
(e) having started the cooperation of the "direct" tools for drawing (ruler, square, protractor, compass, ...) and the use of computer (to create both "freehand" and "geometric" designs), highlighting, operationally, the different techniques and different ideas to use than using non-IT devices.
While some geometric concepts must be consolidated analytically (point as a pair of real numbers, figure as a set of points, direction as an element of the interval
These are introductions of ideas that abstract and generalize "physical" concepts (from positions on lines and surfaces determined with measuring instruments to points such as pairs of numbers, from angles measured with a protractor to their measurement as difference of directions, ...) , to be addressed after carrying out reflections and operational activities (with drawing and measuring instruments) in "concrete" situations. Then, the dynamic geometry software can favor these intertwining and abstractions (which can also be developed by relying on animated gifs, such as these).
 | From primary school it must be remembered how the circumference is calculated: if I enlarge or shrink a circle, the ratio between its width, that is its diameter, and its length, that is its perimeter (which in the case of circles is called circumference), does not change, and it is seen (as can be observed by measuring the circumference of a bicycle wheel with a tape measure) that it is 3 and something. It should be remembered that it holds more precisely 3.141592653… and that it is indicated by the Greek letter π, which is the initial of the Greek word perimetros: the perimeter of the circle of diameter D is π·D. And it should be noted that this number (such as √2 or √3) cannot be expressed as a fraction. |
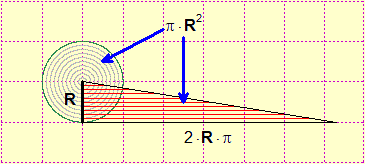
| And it is worth remembering how the area of a circle can be determined: a circle of radius R can be unrolled (as seen in this animation) in a right triangle with a cathetus as long as the circumference and the other as long as the radius , and conclude that its area is π·R²: |
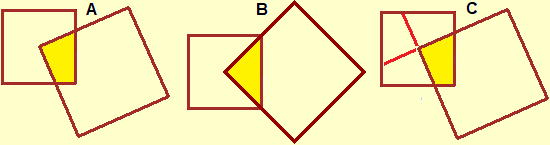
As we have already pointed out, the differences between intuitive arguments and demonstrations (such as the one mentioned in the previous animation) must be gradually brought into focus. For example in the following case where the big square has a vertex in the center of the small square (figure A) I can assume that the part in common with the two squares is about a quarter of the small square, I can believe that things are exactly like that thinking about fact that by rotating the big square I can get to figure B, but to demonstrate that this is valid in general I have to do the reasoning illustrated in figure C.
And, as already observed (see HERE), the construction of concepts and mathematical language, and of the meaning of definitions, must be taken care of rather than the memorization of some definitions, often wrong. Clamorous are the wrong definitions of parallelism spread in many textbooks: see here.
The conflicts between mathematical terminology and common language must also be highlighted: the different meanings of angle, direction, distance, curve, ... There are many common words used with different meanings; think that in normal communication when we speak of a rectangular table we mean one that is not square, while in mathematics rectangles are particular squares. This also refers to the way in which the concepts are defined: if I say that an isosceles triangle is a triangle that has two equal sides meaning that the equilateral triangles are also isoscosceles, I imply that "two" stands for "at least two", not for " exactly two "; for the "educated" adult this is obvious, for the student not; therefore it is necessary that the teacher, if he does not want to give birth to misconceptions, in the first years of school uses these longer expressions to distinguish the two cases. Think then of the many meanings that the equal word has in mathematics, completely different from the profoundly incorrect ones attributed to it by many books ("equal" as "being the same thing"): see the many examples presented here.
And the fact that in practice we can only obtain approximate estimates of areas (and volumes) should be brought into focus. This, moreover, constitutes a first introduction to activities which will then be studied in depth in the upper school and will be important points of reference for dealing with other topics (for example, work in physics and integrals in mathematics).
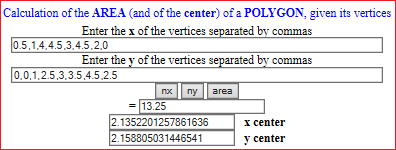
Two examples: the calculation of the area of a small field, made by triangulating the area and calculating the sum of the areas of the triangles (which, if desired, can be calculated starting from the dimensions of the sides: see), and then, having understood the procedure, the calculation downloaded to a programa (below how the central drawing and the calculation with R are done; further on, the calculation performed with this online program, which also calculates the center of the polygon); the calculation of the volume of a box in cm³, first by truncating the measurements of the sides to cm (3�2�2), then to mm (3.6�2.1�2.2), �, obtaining gradually better approximations.
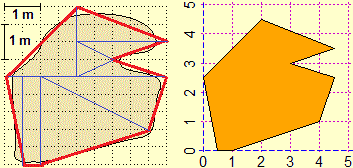 | 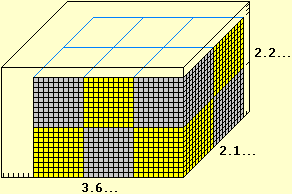 |
PLANE(0,5, 0,5); x = c(0.5,1,4,4.5,3,4.5,2,0); y = c(0,0,1,2.5,3,3.5,4.5,2.5) polyC(x,y, "orange"); areaPol(x,y) # 13.25 m^2 | |
It is necessary, then, to resume from primary school (in view of in-depth studies to be addressed in the secondary school of 2nd degree) some considerations on three-dimensional geometry which were, historically, several centuries ago, at the basis of the development of most of mathematics, with intertwining with themes which are more specifically addressed by other disciplines (geography, drawing, ...). The first aspect is that of perspective, which children encounter from an early age when they have to draw objects or landscapes they see or have seen, roads or itineraries they have traveled, …, also relying on the drawing of buildings or landscapes on transparent sheets attached with adhesive tape to the classroom window, to the examination of perspective views of neighborhoods and other areas using the computer, … arriving to face exercises with pen and paper.
|
|
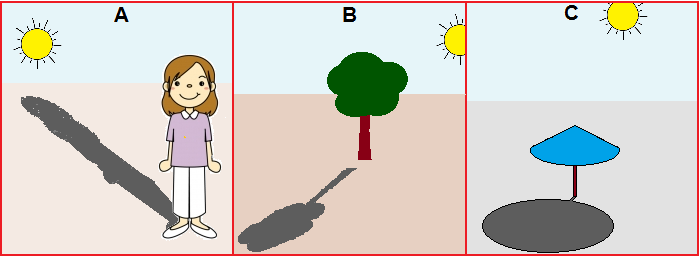
A particular aspect that emerges from experiences such as those discussed above is the drawing of the shadows. Verification activities (or starting points for new experiences) can be faced, such as explaining in words which or which of the three figures A, B and C below are wrong and why. Or activities in which first considerations are made on the link between shadows and the position of the sun, on the reasons why we see parallel shadows not parallel, straight roads with parallel edges we see them transformed into half-lines that have the origin in common. Or think of the observation of the sundials, to a first focusing of the link between the shadow of the gnomon and the time of day, … Or of subsequent experiences in which the ideas emerged are consolidated using a flashlight and examining the shapes that take on squares, rectangles, circles, … projected onto the wall.
 |
| ||
| why are they wrong? |
In addition, other aspects can be brought into focus, which will be taken up and deepened in the following school levels: the fact that while the two clips below drawn can be transported on each other this does not happen for the handles, the fact that the portions of the surface terrestrial are not flat, and can be represented by different maps, which retain some but not all aspects, … with evident links with problems faced in drawing or geography (and with developments on the surface extension and volume of the sphere).
 | 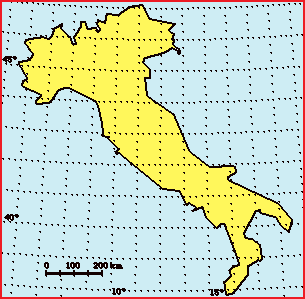 | → |  |
Rather, what must be brought into focus is that the "Pythagorean theorem", which can be conjectured in the way pictured below on the left (see), applies only, in an approximate way, to small portions of the earth's surface, into which the figures keeping their extension. It should be noted that the theorem does not apply to the whole of the earth's surface (one eighth of a sphere is a triangle with three right angles). And, in connection with what has been observed above, it is necessary point out that the distances between the meridians decrease as they move us away from the equator (so it makes no sense to use the theorem for the calculation of large distances).
 |  | 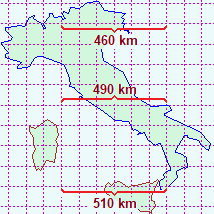 |
These concepts, as already mentioned, will have to be taken up and deepened later, from the viewpoint of a "spiral" resumption of the topics: as the school curricula for many years have underlined, it is not a question of making "advances", but of using in appropriate ways, terminologies and concepts that find natural intertwining with other concepts and lay the foundations for the construction of subsequent levels of formalization. This aspect seems fundamental to us, both to give a correct and "lively" image of mathematics, and not to favor mental stiffenings that identify concepts with particular definitions, particular calculation procedures, ... and classify them into areas (geometry, algebra, geography, drawing, ...) not communicating with each other.
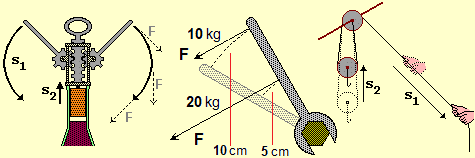
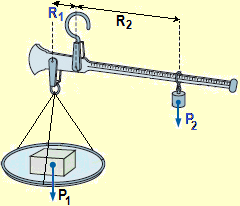
The inverse proportionality is of fundamental importance in all mathematics and in all its applications. Certainly, in 1st grade secondary school, situations such as those illustrated in the following figures must be addressed, in which it is highlighted that, with the same effect, the force exerted and the length of the trajectory along which it is exercised are inversely proportional. It is not the case to deepen from the point of view of "physics" this topic, which will surely be taken up in the secondary school of the 2nd degree, but it is the case to focus it, mathematizing it, right from the basic school (because to push a door if I approach the axis of rotation do I have to make a greater effort?). In the case of the steelyard (figure on the right, where R1 and P2 are fixed), I have to modify R2 so that its product with P2 equals that between P1 and R1 (see HERE for other examples).
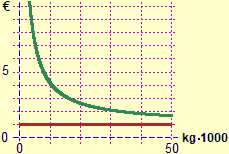
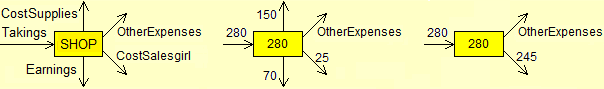
"Of a win to the football pool, how much belongs to each winner as function of to the number of them". "I have a photocopier rented monthly. How much does a photocopy cost on average per month as function of the number of photocopies made?" (see the graph above). These too are examples in which inverse proportionality functions intervene that could be addressed.
 |  |
Subsequently, in the first two years of the upper secondary school, starting from examples of this type it will be possible to study the abstract functions
Addressing the descriptive statistics, the basic concepts and techniques for the representation and study of random variables should already have been introduced. By addressing the field of probability, the transition is made to the case in which "forecasts" are made, based on statistical considerations, beliefs or information of various kinds.
|
The teaching of probability is often dealt with in "harmful" ways: think of the many books in which "definition" is defined as the ratio of |
|
Of the concept of probability it is necessary to specify the rules to which it must submit, making it clear that the choice of the probability values to be assigned does not depend, in the first instance, on mathematical considerations, but on experiments, ideas, assumptions, ... in which mathematics has no leading role. In practice, at adult level, we can say that it is an axiomatic definition (the one recalled in the following figure, in which A1, A2, A3, … are incompatible events), like various other definitions that pupils have encountered in their studies, even if they were not called in this way (much of the arithmetic, for example, is learned "axiomatically"). This is the first context in which it is clear and significant to explain this aspect: it is "obvious" that if I believe that with the probability of 50% Inter will beat Milan and that at 20% the two teams will draw, for me at 100% - (50% + 20%) = 30% Milan will beat Inter Milan. "Cases/cases" have nothing to do with it, only the properties referred to in the following figure are involved, which are none other than the properties already seen for the percentage frequencies, the same that are used to trace areograms, histograms, boxplots, .…!
 |
In addition to situations, such as that of the previous example (Inter-Milan), in which the probabilistic assessments are subjective, or that of the not fair die, in which they can be made after assigning the exit probabilities of the various faces after the experiments, there they are also situations in which the outputs are infinite, as in the following example. That's why the "..." in the figure above.
|
I throw a balanced coin N times until I get "heads". Sometimes N = 1 is enough, sometimes N = 2, sometimes N = 3, ..., but an innumerable number of attempts may be necessary. What is the probability that N = 1 is enough? That N = 2 enough? ... |
As we have seen, the tools that intervene to mathematize situations of uncertainty are largely the same as those used in other areas of mathematics. Tree graphs and percentage breakdown tables are particularly useful for tackling another concept that should be brought into focus in the lower secondary school, and then taken up again in the first two years of the upper secondary school: the concept of dependence/independence of events and random variables:
|
What is the probability that, when I cut the cards twice, I always get a denier card? |
 |
What is the probability that, when I extract two cards from a pack, I always get a denier card? |
 |
Many of the examples that can be faced refer to the game, partly because of the very nature of the probabilistic concepts, partly because they are more easily modeled situations, in which it is easier to extract the significant aspects. But it is good to refer also to non-gaming contexts, for example to situations in which, based on probabilistic evaluations, choices must be made in a productive activity or in a judicial context, or in which biological or health assessments must be made. Just think of genetics (for an example of activity see HERE).
The fact that probabilistic tools (and statistical ones) are to be used (and whose outcomes are to be interpreted) in contexts that are not purely mathematical is perhaps the reason why they are often overlooked by teachers or developed in completely incorrect ways. On the contrary, it is essential, from an educational point of view, to tackle this subject, also trying to highlight the difficulties and errors that pupils can commit by tackling probabilistic issues. This is a decisive aspect for this area of mathematics, also to encourage the development of attentions towards the nonsense that various mass media often propose by referring to probabilistic evaluations.
In the upper secondary school, the areas of statistics and probability will find a stronger intertwining when the theoretical topics for which, in a statistical experiment, as the tests increase, the ratio between the number favorable exits and the total number of exits tends to stabilize on probability. Here teachers can find a brief history of the calculation of probabilities.
Relations with the other disciplinary areas
In the initial paragraph, on the concept of model, we discussed at length the relationships between reality and the various models, disciplinary and non-disciplinary, with which it, or its particular aspects, can be represented and studied. We also highlighted the differences between the mathematical models and the other disciplinary models, and the didactic attentions that all these aspects must urge in those who have the task of educating the new generations, especially in the early scholastic levels.
While the other disciplines refer to different types of phenomena, mathematics is characterized by the type of artifacts it employs and is organized on the basis of their properties and the formal relationships between them, even if some border sectors (computer science, econometrics, mathematical physics, ...) are characterized by the relationship with certain disciplines and technological areas.
But, as we have highlighted above, the birth and historical development of the various mathematical concepts has become intertwined with other knowledge, and the ability to use mathematical artifacts depends on the knowledge of the contexts in which they are used.
In the long journey of school and extracurricular learning, through which we become adults, things initially acquired as abstractions then become concrete "objects" to describe "reality" on which to create new abstractions.
But, for this process to develop effectively, this concrete-abstract passage must be gradual, be "perceived" by the pupils, refer to the various cognitive aspects with which in everyday life they have to do, to get there progressively to forms of knowledge organized disciplinarily.
Mathematics and science teachers must take care of this aspect, highlighting and focusing both the differences and the relationships between the two disciplinary areas, and between them and the other disciplinary areas.