The files plot the graphs of continuous functions; vertical segments may appear at points of discontinuity.
Only a grid of horizontal lines is drawn automatically and the interval of the abscissas is chosen so as to contain all the points.
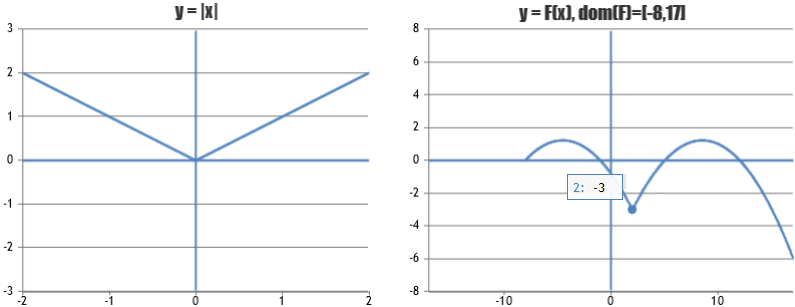
In these cases (y = |x|; y = −3+1.3·|x−2|−0.1·|x-2|^2
with x from −8 to 17)
axes have been plotted. How did we proceed?
In the first case ( y=|x| )
(0,0) is (input, output) of the function in the center of [-2,2].
The point corresponds to (x[500], y[500]).
We trace, starting at (0,0) and returning to (0,0), the two segments:
 array("x" => $x[500], "y" => $y[500]),

 array("x" => 0, "y" => 2.95),
 array("x" => 0, "y" => -2.95),
 array("x" => 0, "y" => 0),
 array("x" => -2, "y" => 0),
 array("x" => 2, "y" => 0),
 array("x" => 0, "y" => 0),
 array("x" => $x[500], "y" => $y[500]),
...
 array("x" => $x[1000], "y" => $y[1000])
);
In the second case ( F )
if I want to consider an interval - [−17,17] - that is wider than the domain - [−8,17] -
I have to find the value between x[0] (ie -8),..., x[1000] (ie 17) which corresponds to 0.
In this case (0 − − 8) / (17 − − 8) · 1000 is 320.
$a= -8; $b= 17;
$n=1000; $x = array(); $y = array();
...
 array("x" => $x[320], "y" => $y[320]),

 array("x" => 0, "y" => 0),
 array("x" => 0, "y" => 7.85),
 array("x" => 0, "y" => -7.85),
 array("x" => 0, "y" => 0),
 array("x" => -17, "y" => 0),
 array("x" => 17, "y" => 0),
 array("x" => 0, "y" => 0),
...
 array("x" => $x[1000], "y" => $y[1000])
);