If you click here and here you can see the graphs.
You can have these files used by directing students to:
http://macosa.dima.unige.it/handbook/graph_php/fish.php
http://macosa.dima.unige.it/handbook/graph_php/astroid.php
or you can save them (with extension ".php", possibly changing the names) in any computer.
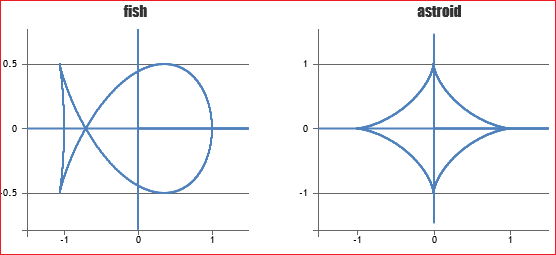
The curves are: x=(cos(t)-(sin(t)^2)/sqrt(2)), y=sin(t)*cos(t);
x=cos(t)^3, y=sin(t)^3.
See this document for other "php" charts, for more information on them, and to see how to change them.