Example 1:
Heights of students (males and females) in a university course (cm):
males:
168, 183, 186, 184, 176, 184, 184, 188, 184, 181, 188, 182, 178, 170, 180, 184, 175, 186, 188, 167, 179, 178, 178, 189, 189, 181, 175, 178, 183, 170, 176, 184, 186, 181, 173, 176, 185, 190, 167, 175, 167, 185, 173, 189, 187, 177, 170, 183, 189, 172, 175, 180, 181, 184, 174, 170, 172
females:
154, 167, 172, 174, 159, 177, 172, 176, 176, 159, 172, 169, 165, 167, 157, 157, 160, 171, 165, 169, 165, 164, 164, 163, 170, 175, 172, 159, 158, 161, 163, 173, 159, 171, 156
If I put the heights of the boys and the heights of the girls, I have:
boys: n = 57 min = 167 max = 190
girls: n = 35 min = 157 max = 177
To compare the boxplots of the two data classes I take m = 150 and M = 195.
girls:
150*0, 154, 167, 172, 174, 159, 177, 172, 176, 176, 159, 172, 169, 165, 167, 157, 157, 160, 171, 165, 169, 165, 164, 164, 163, 170, 175, 172, 159, 158, 161, 163, 173, 159, 171, 156, 195*0
boys:
150*0, 168, 183, 186, 184, 176, 184, 184, 188, 184, 181, 188, 182, 178, 170, 180, 184, 175, 186, 188, 167, 179, 178, 178, 189, 189, 181, 175, 178, 183, 170, 176, 184, 186, 181, 173, 176, 185, 190, 167, 175, 167, 185, 173, 189, 187, 177, 170, 183, 189, 172, 175, 180, 181, 184, 174, 170, 172, 195*0

I can merge the graphs into one image:

If I want to plot the histograms I can use this script.
To evaluate the accuracy of the average height of young people of that age (and in that geographical area) I can use this script:
median = 181
1^,3^ quartile, diff.: 175 185 10
mean = 179.59649122807016
3*sigma = 2.627063795720085
179.59649122807016 round to 1^ digit after units: 179.6
I can take (for males) 179.6 or rather 179.60±2.63. For females I have:
median=165
1^,3^ quartile, diff.: 159 172 13
mean = 166.02857142857144
3*sigma = 3.369255816037154
166.02857142857144 round to 1^ digit after units: 166.0
I can take 166.0 or rather 166.03±3.37.
Example 2:
Weight of the same students (kg):
males:
64, 66, 73, 86, 70, 75, 68, 86, 88, 63, 73, 70, 69, 66, 77, 80, 80, 77, 82, 61, 77, 71, 59, 84, 86, 70, 77, 70, 97, 68, 66, 70, 70, 68, 70, 68, 81, 73, 61, 73, 59, 70, 68, 67, 70, 68, 64, 82, 86, 66, 68, 74, 64, 64, 62, 56, 70
females:
63, 54, 59, 63, 55, 57, 53, 66, 68, 51, 57, 59, 55, 59, 59, 54, 53, 57, 61, 57, 54, 55, 52, 46, 52, 68, 50, 53, 49, 43, 57, 60, 50, 68, 49
If I put the weights of the boys and of the girls, I have:
boys: n = 57 min = 56 max = 97
girls: n = 35 min = 43 max = 68
To compare the boxplots of the two data classes I take m = 40 and M = 100.
girls:
40*0, 63, 54, 59, 63, 55, 57, 53, 66, 68, 51, 57, 59, 55, 59, 59, 54, 53, 57, 61, 57, 54, 55, 52, 46, 52, 68, 50, 53, 49, 43, 57, 60, 50, 68, 49, 100*0
boys:
40*0, 64, 66, 73, 86, 70, 75, 68, 86, 88, 63, 73, 70, 69, 66, 77, 80, 80, 77, 82, 61, 77, 71, 59, 84, 86, 70, 77, 70, 97, 68, 66, 70, 70, 68, 70, 68, 81, 73, 61, 73, 59, 70, 68, 67, 70, 68, 64, 82, 86, 66, 68, 74, 64, 64, 62, 56, 70, 100*0

With this script:
Male: mean = 71.7719298245614 3*sigma = 3.331342566059769 71.77±3.33
Female: mean = 56.17142857142857 3*sigma = 3.0734349514769925 56.17±3.07
Example 3:
The comparison of two pieces, in Italian and in English.
English:
Few congress venues in Europe can boast such a scenic location. The 'Magazzini del Cotone' Congress Centre looks out over the waters of the old port from the 'Molo Vecchio' quay. The 'Porto Antico' is at the very heart of Genoa's old quarter, the liveliest and most picturesque part of the city.
Italiano:
Poche sedi congressuali in Europa possono vantare una collocazione altrettanto scenografica: il Centro Congressi dei Magazzini del Cotone, dalla banchina del Molo Vecchio si specchia nel bacino del Porto Antico, per secoli cuore della città. La parte storica di Genova, la più vivace e suggestiva, converge qui.
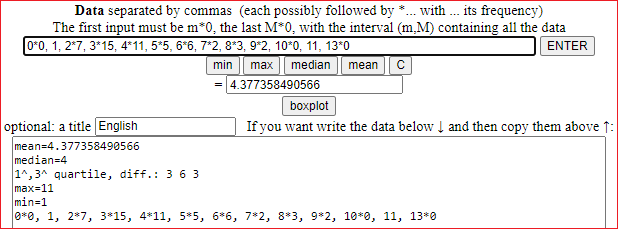
The words, distributed by length:
English: 1, 2*7, 3*15, 4*11, 5*5, 6*6, 7*2, 8*3, 9*2, 10*0, 11
Italiano: 1, 2*6, 3*9, 4*2, 5*7, 6*8, 7*4, 8*3, 9*2, 10*1, 11*1, 12*3
The histograms:

The boxplots so that they are comparable:
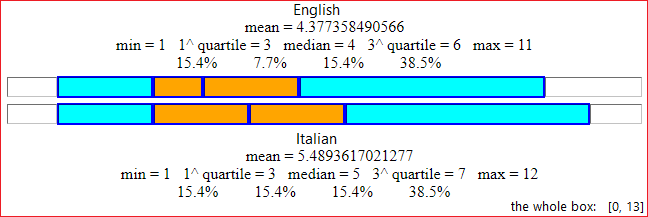
In either case, when introducing the data, I prefaced them with "0 * 0," and followed them with ", 13 * 0", 0 being less than all the data of both sequences of data and being 13 greater than them. This way I get two boxplots which, if I don't change the size of the window, I can copy and paste into a single graphic document so I can compare them.