
Example 1:
Weights of a group of twelve year old Ligurian males / pesi di un gruppo di dodicenni maschi liguri (kg)
27.3, 29.2, 32, 32.3, 32.5, 32.8, 33.7, 34.2, 34.4, 34.5, 34.9, 35, 35.2, 36.1, 36.2, 36.4, 36.5, 36.8, 37, 37.2, 37.5, 37.8, 38, 38.2, 38.3, 38.7, 39, 39, 39.2, 39.6, 39.7, 39.8, 40.2, 41, 41.2, 41.3, 41.4, 41.4, 42.1, 42.3, 42.6, 43.1, 43.4, 43.4, 43.4, 43.9, 44.2, 44.2, 45.2, 45.4, 45.9, 46, 46, 46, 47.2, 47.6, 48, 48.4, 48.7, 49.2, 49.7, 50, 50.8, 51, 51.2, 51.3, 51.5, 51.5, 52, 52, 52.3, 53, 53.5, 54.2, 55, 55.2, 59, 60.2, 62.3, 64.2, 65, 66.3, 69.2, 75.5, 79.3
Excluding borderline cases:

The histogram (constructed with this analogous script):

Example 2:
Deaths per 10000 inhabitants per age group / morti ogni 10000 abitanti per fascia di età (Italy, 2006).
[0,5) 43       [5,10) 5      [10,15) 6     [15,20) 16
[20,25) 23     [25,30) 26    [30,35) 28    [35,40) 37
[40,45) 56     [45,50) 88    [50,55) 141   [55,60) 225
[60,65) 350    [65,70) 518   [70,75) 814   [75,80) 1245
[80,85) 1771   [85,90) 2027  [90,95) 1643  [95,100) 727
[100,105) 195  [105,110) 17
10001 data in 22 intervals |
The sum is not 10000, due to rounding (in a publication in which there are tables in which the sum of the percentages is always 100, the percentages may not have been rounded correctly: some tricks have been used to not upset the readers! a trivial example: if A=10, B=10 and C=10, the percentage distribution [33, 33 and 33, or 33.3, 33.3 and 33.3, or ...] cannot add up to 100).
The histogram (constructed with this analogous script - with tighter rectangles than the previous one):

To build the boxplot, in place of each interval, I take its center. Each data is not single; after each data I put "*F", where F is its frequency.
2.5*43, 7.5*5, 12.5*6, 17.5*16, 22.5*23, 27.5*26, 32.5*28, 37.5*37, 42.5*56, 47.5*88, 52.5*141, 57.5*225, 62.5*350, 67.5*518, 72.5*814, 77.5*1245, 82.5*1771, 87.5*2027, 92.5*1643, 97.5*727, 102.5*195, 107.5*17

n = 10001 median = 82.5 1^|3^ quartile = 77.5 | 92.5 mean = 81.13363663633636

Example 3:
Human body weight (peso corporeo); 4170 Italian males in their twenties, in the year 1990. (here).
We have seen how to obtain the following histogram and the following elaborations:
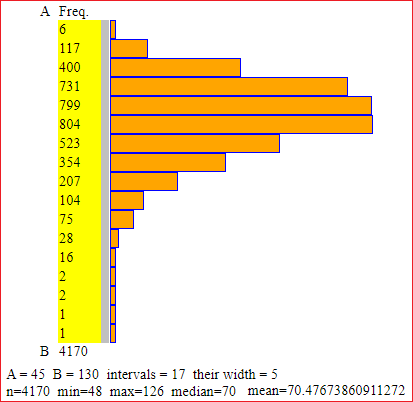
With this script I can get:

and clicking "boxplot":

The central 50% of the data is in [63, 76], an interval of amplitude 13. The average weight (of Italian males in their twenties, in the year 1990) is 70.48 kg. The second boxplot overlooks the start and end queues:
