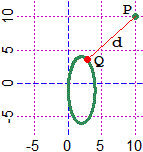
The distance from (10, 10) and the curve x=2+2*cos(t), y=−1+5*sin(t):
distance = 9.64470018696
nearest point of the curve = (2.815578657, 3.565380224)

| First example. The distance from (10, 10) and the curve x=2+2*cos(t), y=−1+5*sin(t): distance = 9.64470018696 nearest point of the curve = (2.815578657, 3.565380224) |  |
function x(t) { with(Math) {
return  2+2*cos(t)
}}
function y(t) { with(Math) {
return  -1+5*sin(t)
}}

We can draw the graph with JavaScript; for example, see the script curve_P (see the code; se also here).

| Other x(t), y(t) The distance from (−1, 1) and the curve x=3·t/(1+t³), y=3·t²/(1+t³) (Folium of Descartes): distance = 0.55934880423712 nearest point of the curve = (−1.33573753, 0.55261717) |  |
function x(t) { with(Math) {
return  3*t/(1+pow(t,3))
}}
function y(t) { with(Math) {
return  3*t*t/(1+pow(t,3))
}}
d = 0.5593488042371204  Q = (-1.3357375259792503,0.5526171679078099)
        t = -0.41371688461225     a = -0.4137169  b = -0.4137168
d = 0.5593488042371205  Q = (-1.3357375278902461,0.5526171693419127)
        t = -0.413716885094     a = -0.413717  b = -0.413716
d = 0.5593488042371205  Q = (-1.3357375309486323,0.5526171716370724)
        t = -0.413716885865     a = -0.41372  b = -0.41371
d = 0.5593488042371255  Q = (-1.335737587019048,0.5526172137150007)
        t = -0.4137169     a = -0.5  b = -0.4
d = 0.5593488044301476  Q = (-1.335749884071111,0.5526264420378972)
        t = -0.41371999999999786     a = -20  b = 20
| A function The distance from (2, −1) and the graph of x → x²: distance = 1.949088133432 nearest point of the curve = (0.553573773, 0.306443922) |  |
function x(t) { with(Math) {
return  t
}}
function y(t) { with(Math) {
return  pow(t,2)
}}
d = 1.9490881334319283  Q = (0.55357377306562,0.3064439222261065)
        t = 0.55357377306562     a = 0.55357377  b = 0.55357378
d = 1.9490881334319283  Q = (0.55357377308585,0.30644392224850414)
        t = 0.55357377308585     a = 0.5535737  b = 0.5535738
d = 1.9490881334319283  Q = (0.55357377338,0.30644392257417163)
        t = 0.55357377338     a = 0.55357  b = 0.55358
d = 1.9490881334319287  Q = (0.5535738,0.30644395204644)
        t = 0.5535738     a = 0.5  b = 0.6
d = 1.949088133449685  Q = (0.5535700000000006,0.30643974490000064)
        t = 0.5535700000000006     a = -10  b = 10
Graphs like the ones shown here can be plotted also with R (see).