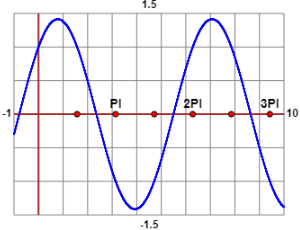
• If the function is F: x → sin(x)+cos(x), that I could graphically
represent with this script
(Alternatively, I can use pocket calculator directly)
if I look for the first positive "x" such that F(x) = 0, F(x) = 1/2 or F(x) = 1 I have:
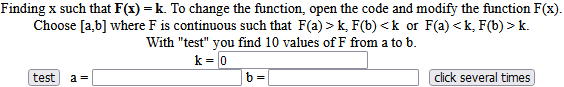
k=0
a=2   b=3   [...]
a=2.356194490192345   b=2.3561944901923453
k=0.5
a=1   b=3   [...]
a=1.994827366285637   b=1.9948273662856373
k=1
a=1   b=2   [...]
a=1.5707963267948963   b=1.5707963267948966
2.356194490192345 1.994827366285637 1.57079632679490 (= π/2; why?)
function F(x) {
with(Math) {
/// you can change F [ now it is  x - > sin(x)+cos(x) ]
return sin(x)+cos(x)
}}
• If I want to find the intersections between y = sin(x) and y = x²+x+k for k = 0 (green), k = -0.5 (red), k = -1 (orange) [see this script]
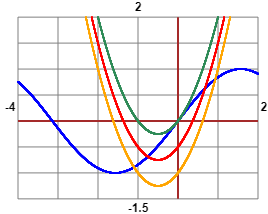
I look for the "x" such that F(x)=k if F(x) = sin(x)-(x*x+x)
k = -1
a = -2  b = 0   [...]
a = -1.0992696791115828   b = -1.0992696791115826
  intersection x = -1.099269679111583
a = 0  b = 2   [...]
a = 0.9329651326642826   b = 0.9329651326642827
  intersection x = 0.932965132664283
k = -0.5
a = -1   b = 0
a = -0.7547466542351537   b = -0.7547466542351536
  intersection x = -0.754746654235154
a = 0   b = 1
a = 0.6713389450680209   b = 0.671338945068021
  intersection x = 0.671338945068021
If k = 0 it seems that the two graphs touch at one point.
With [test] I see what happens between -1 and 1
k = 0
a = -1  b = 1   [test]
-0.84147098481  -0.5573560909  -0.3246424734  -0.14941834231  -0.0386693308
0  -0.0413306692  -0.17058165769  -0.3953575266  -0.7226439091  -1.15852901519
In the value halfway between -1 and 1 (0) F has the value 0:
there the sinusoid is tangent to the parabola.
Moreover it is evident that for x = 0  sin(x) = x*x+x

function F(x) {
with(Math) {
/// you can change F [ now it is  x - > sin(x)-(x*x+x) ]
return sin(x)-(x*x+x)
}}
I can check the solutions with WolframAlpha: