


You can draw various bar graphs, even with negative values, also to get an idea of the trend of a function (if you cannot use other software).

graph on the left:
(positive) temperature at 12 on several successive days.
name = [me   ]  value = [24   ]   [Enter]
              [Calculate]
ma) 19
lu) 16
do) 22
sa) 22
ve) 19
gi) 20
me) 19
ma) 18
lu) 24
      temperature alle 12  [title]  0 [inf]
graph on the right:
some "points" of the graph of x → (x−1)² − 5:
name = [-3   ]  value = [11   ]   [Enter]
              [Calculate]
-2) 4
-1) -1
 0) -4
 1) -5
 2) -4
 3) -1
 4) 4
 5) 11
        y = (x-1)^2+5   [title]    -6 [inf]
                                    |
                              a value < -5
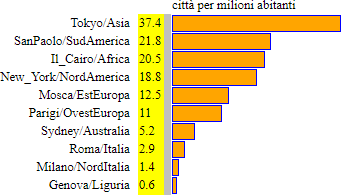
chart below:


HELP
You can resize.
If you open the file by pressing the right mouse button you can select "open in a new window".
Go back, or reload the file, for a new data series.
With Alt_Print you can copy the page and paste it into Paint or other applications.
Do not change the page size if you want to compare different histograms.
To change the height of the columns, you can put a number in the box to the right of the "help" button (with 100, columns of a standard length, with a larger number [200, 300, ...] columns of shorter length, with a smaller number [90, 80, ...] columns of greater length.
You should copy the start page or the final page with the data introduced if you then want to paste them to review or modify them.
Average grain yield in Europe over several years:

Unemployed in Italy with different scales:
