 |
64, 66, 73, 86, 70, 75, 68, 86, 88, 63, 73, 70, 69, 66, 77, 80, 80, 77, 82, 61, 77, 71, 59, 84, 86, 70, 77, 70, 97, 68, 66, 70, 70, 68, 70, 68, 81, 73, 61, 73, 59, 70, 68, 67, 70, 68, 64, 82, 86, 66, 68, 74, 64, 64, 62, 56, 70
|
|
A = 55 B = 100 intervalli = 9 di ampiezza 5 - pesi maschi 13-enni
n = 57 min = 56 max = 97 mediana = 70 1^|3^ quarto = 66|77 media = 71.7719298245614
percentuali:
| 5.26 | 14.04 | 22.81 | 28.07 | 8.77 | 10.53 | 8.77 | 0 | 1.75 |
corrispondenti alle frequenze:
3+8+13+16+5+6+5+0+1
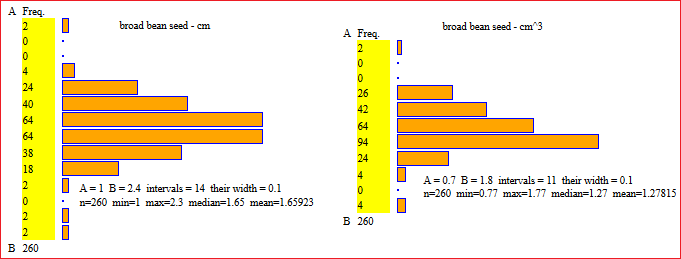
broad bean seed - lengths (cm):
1.35, 1.65, 1.80, 1.40, 1.65, 1.80, 1.40, 1.65, 1.85, 1.40, 1.65, 1.85, 1.50, 1.65, 1.90, 1.50, 1.65, 1.90, 1.50, 1.65, 1.90, 1.50, 1.70, 1.90, 1.50, 1.70, 1.90, 1.50, 1.70, 2.25, 1.55, 1.70, 1.55, 1.70, 1.55, 1.70, 1.60, 1.70, 1.60, 1.75, 1.60, 1.75, 1.60, 1.80, 1.60, 1.80, 1.60, 1.80, 1.60, 1.80, 1.00, 1.55, 1.70, 1.75, 1.30, 1.55, 1.70, 1.75, 1.40, 1.60, 1.70, 1.75, 1.40, 1.60, 1.70, 1.80, 1.40, 1.60, 1.70, 1.80, 1.40, 1.60, 1.70, 1.80, 1.40, 1.60, 1.70, 1.80, 1.40, 1.60, 1.70, 1.80, 1.40, 1.60, 1.70, 1.80, 1.40, 1.60, 1.70, 1.80, 1.45, 1.60, 1.70, 1.80, 1.50, 1.60, 1.70, 1.80, 1.50, 1.60, 1.70, 1.85, 1.50, 1.60, 1.70, 1.85, 1.50, 1.60, 1.75, 1.90, 1.50, 1.60, 1.75, 1.90, 1.50, 1.65, 1.75, 1.90, 1.55, 1.65, 1.75, 1.95, 1.55, 1.65, 1.75, 2.00, 1.55, 1.65, 1.75, 2.30, 1.35, 1.65, 1.80, 1.40, 1.65, 1.80, 1.40, 1.65, 1.85, 1.40, 1.65, 1.85, 1.50, 1.65, 1.90, 1.50, 1.65, 1.90, 1.50, 1.65, 1.90, 1.50, 1.70, 1.90, 1.50, 1.70, 1.90, 1.50, 1.70, 2.25, 1.55, 1.70, 1.55, 1.70, 1.55, 1.70, 1.60, 1.70, 1.60, 1.75, 1.60, 1.75, 1.60, 1.80, 1.60, 1.80, 1.60, 1.80, 1.60, 1.80, 1.00, 1.55, 1.70, 1.75, 1.30, 1.55, 1.70, 1.75, 1.40, 1.60, 1.70, 1.75, 1.40, 1.60, 1.70, 1.80, 1.40, 1.60, 1.70, 1.80, 1.40, 1.60, 1.70, 1.80, 1.40, 1.60, 1.70, 1.80, 1.40, 1.60, 1.70, 1.80, 1.40, 1.60, 1.70, 1.80, 1.40, 1.60, 1.70, 1.80, 1.45, 1.60, 1.70, 1.80, 1.50, 1.60, 1.70, 1.80, 1.50, 1.60, 1.70, 1.85, 1.50, 1.60, 1.70, 1.85, 1.50, 1.60, 1.75, 1.90, 1.50, 1.60, 1.75, 1.90, 1.50, 1.65, 1.75, 1.90, 1.55, 1.65, 1.75, 1.95, 1.55, 1.65, 1.75, 2.00, 1.55, 1.65, 1.75, 2.30
alternative:
1*2, 1.3*2, 1.35*2, 1.4*22, 1.45*2, 1.5*24, 1.55*16, 1.6*42, 1.65*22, 1.7*42, 1.75*22, 1.8*30, 1.85*8, 1.9*16, 1.95*2, 2*2, 2.25*2, 2.3*2
alternative (by using ord.htm):
1, 1, 1.3, 1.3, 1.35, 1.35, 1.4, 1.4, 1.4, 1.4, 1.4, 1.4, 1.4, 1.4, 1.4, 1.4, 1.4, 1.4, 1.4, 1.4, 1.4, 1.4, 1.4, 1.4, 1.4, 1.4, 1.4, 1.4, 1.45, 1.45, 1.5, 1.5, 1.5, 1.5, 1.5, 1.5, 1.5, 1.5, 1.5, 1.5, 1.5, 1.5, 1.5, 1.5, 1.5, 1.5, 1.5, 1.5, 1.5, 1.5, 1.5, 1.5, 1.5, 1.5, 1.55, 1.55, 1.55, 1.55, 1.55, 1.55, 1.55, 1.55, 1.55, 1.55, 1.55, 1.55, 1.55, 1.55, 1.55, 1.55, 1.6, 1.6, 1.6, 1.6, 1.6, 1.6, 1.6, 1.6, 1.6, 1.6, 1.6, 1.6, 1.6, 1.6, 1.6, 1.6, 1.6, 1.6, 1.6, 1.6, 1.6, 1.6, 1.6, 1.6, 1.6, 1.6, 1.6, 1.6, 1.6, 1.6, 1.6, 1.6, 1.6, 1.6, 1.6, 1.6, 1.6, 1.6, 1.6, 1.6, 1.6, 1.6, 1.65, 1.65, 1.65, 1.65, 1.65, 1.65, 1.65, 1.65, 1.65, 1.65, 1.65, 1.65, 1.65, 1.65, 1.65, 1.65, 1.65, 1.65, 1.65, 1.65, 1.65, 1.65, 1.7, 1.7, 1.7, 1.7, 1.7, 1.7, 1.7, 1.7, 1.7, 1.7, 1.7, 1.7, 1.7, 1.7, 1.7, 1.7, 1.7, 1.7, 1.7, 1.7, 1.7, 1.7, 1.7, 1.7, 1.7, 1.7, 1.7, 1.7, 1.7, 1.7, 1.7, 1.7, 1.7, 1.7, 1.7, 1.7, 1.7, 1.7, 1.7, 1.7, 1.7, 1.7, 1.75, 1.75, 1.75, 1.75, 1.75, 1.75, 1.75, 1.75, 1.75, 1.75, 1.75, 1.75, 1.75, 1.75, 1.75, 1.75, 1.75, 1.75, 1.75, 1.75, 1.75, 1.75, 1.8, 1.8, 1.8, 1.8, 1.8, 1.8, 1.8, 1.8, 1.8, 1.8, 1.8, 1.8, 1.8, 1.8, 1.8, 1.8, 1.8, 1.8, 1.8, 1.8, 1.8, 1.8, 1.8, 1.8, 1.8, 1.8, 1.8, 1.8, 1.8, 1.8, 1.85, 1.85, 1.85, 1.85, 1.85, 1.85, 1.85, 1.85, 1.9, 1.9, 1.9, 1.9, 1.9, 1.9, 1.9, 1.9, 1.9, 1.9, 1.9, 1.9, 1.9, 1.9, 1.9, 1.9, 1.95, 1.95, 2, 2, 2.25, 2.25, 2.3, 2.3
| I can get tighter rectangles with hist2: |  |
If you want other elaborations use this calculator.
Their volumes (cm³):
1.04, 1.27, 1.39, 1.08, 1.27, 1.39, 1.08, 1.27, 1.42, 1.08, 1.27, 1.42, 1.16, 1.27, 1.46, 1.16, 1.27, 1.46, 1.16, 1.27, 1.46, 1.16, 1.31, 1.46, 1.16, 1.31, 1.46, 1.16, 1.31, 1.73, 1.19, 1.31, 1.19, 1.31, 1.19, 1.31, 1.23, 1.31, 1.23, 1.35, 1.23, 1.35, 1.23, 1.39, 1.23, 1.39, 1.23, 1.39, 1.23, 1.39, 0.77, 1.19, 1.31, 1.35, 1.00, 1.19, 1.31, 1.35, 1.08, 1.23, 1.31, 1.35, 1.08, 1.23, 1.31, 1.39, 1.08, 1.23, 1.31, 1.39, 1.08, 1.23, 1.31, 1.39, 1.08, 1.23, 1.31, 1.39, 1.08, 1.23, 1.31, 1.39, 1.08, 1.23, 1.31, 1.39, 1.08, 1.23, 1.31, 1.39, 1.12, 1.23, 1.31, 1.39, 1.16, 1.23, 1.31, 1.39, 1.16, 1.23, 1.31, 1.42, 1.16, 1.23, 1.31, 1.42, 1.16, 1.23, 1.35, 1.46, 1.16, 1.23, 1.35, 1.46, 1.16, 1.27, 1.35, 1.46, 1.19, 1.27, 1.35, 1.50, 1.19, 1.27, 1.35, 1.54, 1.19, 1.27, 1.35, 1.77, 1.04, 1.27, 1.39, 1.08, 1.27, 1.39, 1.08, 1.27, 1.42, 1.08, 1.27, 1.42, 1.16, 1.27, 1.46, 1.16, 1.27, 1.46, 1.16, 1.27, 1.46, 1.16, 1.31, 1.46, 1.16, 1.31, 1.46, 1.16, 1.31, 1.73, 1.19, 1.31, 1.19, 1.31, 1.19, 1.31, 1.23, 1.31, 1.23, 1.35, 1.23, 1.35, 1.23, 1.39, 1.23, 1.39, 1.23, 1.39, 1.23, 1.39, 0.77, 1.19, 1.31, 1.35, 1.00, 1.19, 1.31, 1.35, 1.08, 1.23, 1.31, 1.35, 1.08, 1.23, 1.31, 1.39, 1.08, 1.23, 1.31, 1.39, 1.08, 1.23, 1.31, 1.39, 1.08, 1.23, 1.31, 1.39, 1.08, 1.23, 1.31, 1.39, 1.08, 1.23, 1.31, 1.39, 1.08, 1.23, 1.31, 1.39, 1.12, 1.23, 1.31, 1.39, 1.16, 1.23, 1.31, 1.39, 1.16, 1.23, 1.31, 1.42, 1.16, 1.23, 1.31, 1.42, 1.16, 1.23, 1.35, 1.46, 1.16, 1.23, 1.35, 1.46, 1.16, 1.27, 1.35, 1.46, 1.19, 1.27, 1.35, 1.50, 1.19, 1.27, 1.35, 1.54, 1.19, 1.27, 1.35, 1.77
| Classified data vedi/see → |  |
Human body weight (peso corporeo); 4170 Italian males in their twenties, in the year 1990. (here)
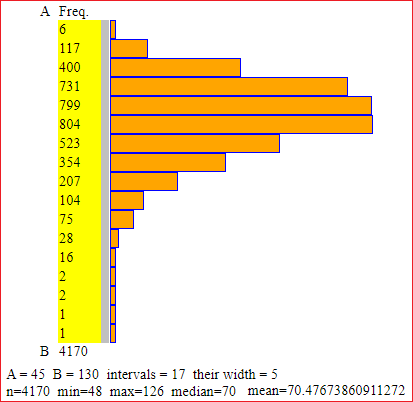
The data are truncated, so 0.5 must be added to the average; then it can be rounded up to tenths: 70.476... → 71.0.
| For histograms, you can use a more complex script: see |  |
| Zombies A 1 long wall; a W wide hole in the wall; every second a zombie arrives in a completely random position of the wall. Let W be 1/10; let's simulate 1 hour. The distribution (in 5 sec intervals) of the waiting times between a pass through the hole of a zombie and the next pass. |
 |
17, 10, 8, 36, 7, 21, 1, 6, 2, 8, 3, 5, 7, 3, 7, 2, 2, 6, 2, 15, 12, 10, 2, 18, 1, 19, 14, 22, 6, 2, 2, 7, 4, 8, 12, 6, 12, 2, 17, 4, 1, 3, 5, 15, 11, 1, 4, 16, 6, 11, 6, 20, 2, 14, 1, 15, 38, 1, 7, 23, 10, 4, 25, 1, 1, 4, 11, 7, 1, 4, 2, 6, 7, 15, 4, 20, 17, 3, 15, 8, 16, 2, 15, 3, 3, 3, 30, 13, 23, 19, 38, 18, 4, 17, 1, 1, 1, 21, 5, 45, 11, 3, 5, 2, 19, 9, 5, 16, 5, 1, 1, 35, 12, 6, 22, 29, 16, 13, 8, 9, 12, 4, 4, 1, 10, 1, 2, 10, 22, 2, 2, 16, 20, 12, 5, 5, 2, 12, 1, 9, 1, 26, 37, 1, 6, 2, 8, 7, 6, 1, 5, 8, 6, 6, 19, 4, 23, 12, 33, 4, 3, 8, 4, 2, 28, 20, 10, 15, 15, 4, 5, 2, 3, 1, 1, 18, 4, 2, 15, 10, 6, 1, 9, 5, 32, 1, 31, 20, 10, 5, 23, 1, 9, 11, 3, 20, 14, 5, 5, 5, 1, 18, 3, 23, 7, 10, 10, 14, 3, 8, 9, 3, 8, 1, 21, 3, 5, 2, 31, 1, 31, 1, 3, 37, 5, 7, 4, 21, 7, 7, 2, 13, 4, 4, 1, 1, 8, 25, 18, 4, 5, 6, 14, 17, 2, 11, 6, 5, 6, 8, 1, 9, 1, 6, 9, 4, 1, 5, 1, 14, 6, 12, 3, 3, 7, 6, 3, 10, 31, 3, 3, 4, 8, 4, 12, 5, 1, 3, 1, 18, 25, 6, 24, 14, 2, 1, 29, 23, 31, 15, 24, 2, 2, 5, 4, 5, 15, 3, 3, 14, 11, 5, 2, 9, 45, 3, 4, 4, 21, 9, 16, 4, 12, 17, 12, 4, 14, 3, 4, 20, 5, 8, 8, 6, 21, 19, 4, 5, 5, 5, 28, 18, 9, 10, 3, 12, 2, 2, 4, 15, 2, 7, 3, 4, 8, 6, 10, 14, 7, 14, 13, 9, 4, 5, 12, 1, 3, 4, 14, 8, 1, 6, 3, 16, 1, 6, 9, 2, 3, 6, 21, 15, 2, 20, 18, 9, 7, 3, 5, 7, 18
 (see also here)
The study of the cast of a die made of thin cardboard:

5,5,4,3,3,1,6,2,5,6,2,5,3,6,5,6,3,2,1,6,1,6,6,3,5,2,1,5,2,5,5,3,6,6,4,6,6,5,6,2,
1,6,6,3,2,2,5,6,3,2,6,6,6,4,2,3,6,6,6,2,6,4,5,4,6,2,3,5,6,6,2,2,1,5,5,3,5,3,5,6,
2,1,4,3,6,6,6,4,3,4,6,6,4,5,4,4,2,2,6,4,4,6,2,5,3,6,6,3,3,2,2,6,1,4,6,5,3,3,4,1,
6,4,6,6,2,5,5,1,5,2,6,5,2,2,4,1,2,2,6,1,6,5,5,6,1,3,3,4,5,5,5,6,4,4,6,3,6,3,6,6,
4,2,6,6,6,1,4,5,6,5,6,5,5,5,6,6,2,1,6,3,6,6,5,3,5,2,2,4,6,6,5,2,5,5,6,6,5,2,6,1

In Italy in 1951, in the age intervals [0,5),[5,10),[10,20),[20,30),[30,40),[40,50),[50,60),[60,75),[75,100) are dead 729,35,77,132,134,285,457,1401,1569 thousand people.
| With a more complex script - see - I get the histogram: |  |
How can I get similar histograms with this script? I can divide some classes so as to obtain all classes of equal size:

A = 0 B = 100 intervals = 20 their width = 5
n = 48190
2.5*7290, 7.5*350, 12.5*385, 17.5*385, 22.5*660, 27.5*660, 32.5*670, 37.5*670, 42.5*1425, 47.5*1425, 52.5*2285, 57.5*2285, 62.5*4670, 67.5*4670, 72.5*4670, 77.5*3138, 82.5*3138, 87.5*3138, 92.5*3138, 97.5*3138
| I can get tighter rectangles with hist2: |  |