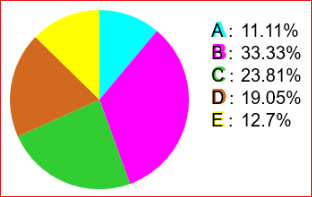
• Al momento lo script traccia il diagramma a torta seguente, relativo ai seguenti dati:
7, 21, 15, 12, 8.
• At the moment the script draws the following pie chart, relating to the following data:
7, 21, 15, 12, 8.
Il codice all'inizio è: / The code at the beginning is:
<canvas width="600" height="300"></canvas>
<script>
n = 5

A = 7
B = 21
C = 15
D = 12
E = 8
F = 0
G = 0
H = 0
I = 0
J = 0
K = 0

var results = [
  {name: "A", count: A, color: "cyan"},
  {name: "B", count: B, color: "magenta"},
  {name: "C", count: C, color: "limegreen"},
  {name: "D", count: D, color: "chocolate"},
  {name: "E", count: E, color: "yellow"},
  {name: "F", count: F, color: "royalblue"},
  {name: "G", count: G, color: "red"},
  {name: "H", count: H, color: "seagreen"},
  {name: "I", count: I, color: "pink"},
  {name: "J", count: J, color: "grey"},
  {name: "K", count: K, color: "coral"}
];
...
Per un altro diagramma devi cambiare le righe tra n = e K = .
For another diagram you have to change the lines between n = and K = .
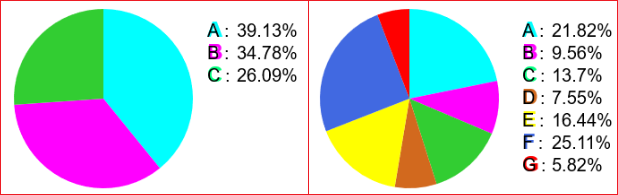
Due esempi. / Two examples.
n = 3                 n = 7

A = 9                 A = 1148
B = 8                 B = 503
C = 6                 C = 721
D = 0                 D = 397
                      E = 865
                      F = 1321
                      G = 306
H = 0 |
Altri script / Other scripts: click.
Prima di usare questo script, è bene che gli alunni abbiano imparato a usare le percentuali e a tracciare a mano i settori che rappresentano le varie parti usando la seguente immagine (vai sull'immagine, premi il pulsante destro del mouse e copia l'immagine o salvane una copia dove vuoi).
If desired, using the percentages (before using this script), the sectors representing the various parts can be drawn by hand using the following image (go to the image, press the right mouse button and copy the image or save a copy wherever you want).

I comandi <canvas width=".." height=".."></canvas> permettono di inserire delle immagini, dimensionate orizzontalmente e verticalmente in pixel. Si possono tracciare figure di vari tipi, non solo cerchi come fatto qui. Il comando per tracciare un punto è cx.moveTo(..,..), quello per tracciare una retta dal punto attuale ad un altro punto è cx.lineTo(..,..). Per altri esempi vedi QUI.
The commands <canvas width=".." height=".."></canvas> allow you to insert images, sized horizontally and vertically in pixels. Figures of various types can be drawn, not just circles as done here. The command to draw a point is cx.moveTo(..,..), the one to draw a line from the current point to another point is cx.lineTo(..,..). For other examples see HERE.