[Se vuoi, puoi salvare i file sul computer, cliccando sul loro nome col pulsante destro del mouse.
Sull'uso di Safari: #
If you want, you can save the files on your computer by clicking on their name with the right mouse button.
On the use of Safari: # ]
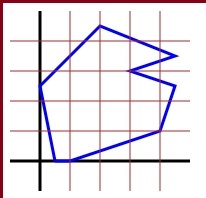
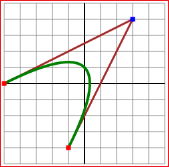
•• Ecco come tracciare la poligonale che parte da (1,0) e torna in (1,0) disegnata
qui a destra.
Vediamo, in particolare, come ottenere, con due script, le due figure seguenti.
I file per ottenerli sono poligo1 e poligo2.
Vediamone i testi.
•• How to draw the polygon that starts from (1,0) and returns to (1,0) with the two scripts poligo1 and poligo2.
| 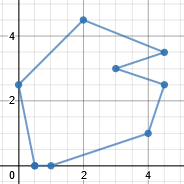 | x1=0.5; y1=0
x2=1; y2=0
x3=4; y3=1
x4=4.5; y4=2.5
x5=3; y5=3
x6=4.5; y6=3.5
x7=2; y7=4.5
x8=0; y8=2.5
x9=0.5; y9=0 |
<canvas width="400" height="400"></canvas>
<script>
x1=0.5; y1=0
x2=1;   y2=0
x3=4;   y3=1
x4=4.5; y4=2.5
x5=3;   y5=3
x6=4.5; y6=3.5
x7=2;   y7=4.5
x8=0;   y8=2.5
x9=0.5; y9=0
Width=400; Height=400 // <-- change
minX=-1; maxX=5; minY=-1; maxY=5
Mx=Width/(maxX-minX)
My=Height/(maxY-minY) // per un sistema monometrico prendi
// for the same scale take My=Mx
B=(0-minX)*Width/(maxX-minX); H=(maxY-0)*Height/(maxY-minY)
function X(a) {return B+a*Mx}; function Y(b) {return H-b*My}
let cx = document.querySelector("canvas").getContext("2d")
cx.moveTo( X(x1), Y(y1) )
cx.lineTo( X(x1), Y(y1)
cx.lineTo( X(x3), Y(y3) )
cx.lineTo( X(x4), Y(y4) )
cx.lineTo( X(x5), Y(y5) )
cx.lineTo( X(x6), Y(y6) )
cx.lineTo( X(x7), Y(y7) )
cx.lineTo( X(x8), Y(y8) )
cx.lineTo( X(x9), Y(y9) )
cx.moveTo( X(-1), Y(0) ) /// asse x da -1 a 5
cx.lineTo( X(5), Y(0) )
cx.moveTo( X(0), Y(-1) ) /// asse y da -1 a 5
cx.lineTo( X(0), Y(5) )
cx.stroke()
</script>
| | <canvas width="400" height="400"></canvas>
<script>
...
let cx = document.querySelector("canvas").getContext("2d");
cx.moveTo( X(x1), Y(y1)
cx.lineTo( X(x1), Y(y1)
cx.lineTo( X(x3), Y(y3) )
cx.lineTo( X(x4), Y(y4) )
cx.lineTo( X(x5), Y(y5) )
cx.lineTo( X(x6), Y(y6) )
cx.lineTo( X(x7), Y(y7) )
cx.lineTo( X(x8), Y(y8) )
cx.lineTo( X(x9), Y(y9) )
cx.moveTo( X(-1), Y(0) ) /// asse x da -1 a 5
cx.lineTo( X(5), Y(0) )
cx.moveTo( X(0), Y(-1) ) /// asse y da -1 a 5
cx.lineTo( X(0), Y(5) )
cx.lineWidth=3
cx.stroke()
cx.lineWidth=1
for(i=1;i<=4;i++) {x=i; cx.moveTo( X(x),Y(-1) ); cx.lineTo( X(x),Y(5) ) }
for(i=1;i<=4;i++) {y=i; cx.moveTo( X(-1),Y(y) ); cx.lineTo( X(5),Y(y) ) }
cx.stroke()
</script> |
 |
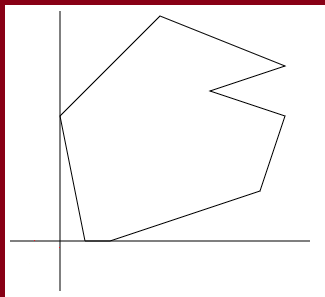
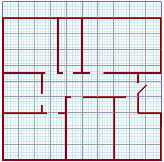
Consideriamo lo script a sinistra. I comandi <canvas width=".." height=".."></canvas> permettono
di inserire delle immagini, dimensionate orizzontalmente e verticalmente in pixel. Il comando per tracciare un punto è cx.moveTo(..,..),
quello per tracciare una retta dal punto attuale ad un altro punto è cx.lineTo(..,..).
Con cx.stroke() viene tracciata la figura secondo i comandi precedentemente introdotti.
I comandi grafici fanno riferimento alle coordinate dei pixel, conteggiate da destra a sinistra e dall'alto in basso (vedi la figura soprastante a sinistra,
di cui sono ingrandite le dimensioni).
In Mx e My viene messo quanto ingrandire la figura rispetto alle dimensioni in pixel.
In H e in B viene messo di quanto spostare verticalmente e orizzontalmente (in pixel) l'origine degli assi.
Nel calcolo della coordinata pixel verticale Y(b) del punto (a,b) non compare +b*My ma −b*My, in modo che delle coordinate verticali venga invertita la direzione.
Le ultime 4 righe, prima di cx.stroke(), tracciano gli assi.
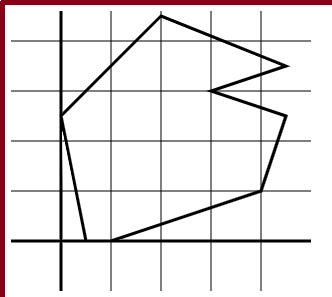
Lo script a destra traccia la figura e gli assi con una linea spessa il triplo grazie al
comando cx.lineWidth=3 prima di cx.stroke. Poi
torna allo spessore normale con cx.lineWidth=1 e traccia segmenti che realizzano una griglia.
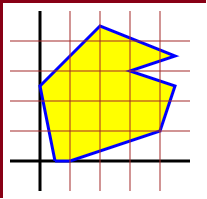
•• Vediamo come modificare il file (vedi poligo3)
per ottenere la figura seguente:
•• Let's see how to modify the file (see poligo3) to obtain the following figure:
Abbiamo ridotto le dimensioni modificando Width e Height.
Poi abbiamo usato due nuovi comandi. Con cx.beginPath() viene avviato il tracciamento di una nuovo pezzo delle figura,
con cx.strokeStyle="..." ne viene definito il colore.
| |
<canvas width="200" height="200"></canvas>
<script>
...
Width=200; Height=200                        // <-- change
...
 let cx = document.querySelector("canvas").getContext("2d");
 cx.beginPath()
 cx.strokeStyle="black"
 cx.lineWidth=3
 cx.moveTo( X(-1), Y(0) )  /// asse x da -1 a 5
 cx.lineTo(( X(5), Y(0) )
 cx.moveTo( X(0), Y(-1) )  /// asse y da -1 a 5
 cx.lineTo( X(0), Y(5) )
 cx.stroke()
 cx.beginPath()
 cx.strokeStyle="blue"
 cx.moveTo( X(x1), Y(y1) )
 cx.lineTo( X(x2), Y(y2) )
 cx.lineTo( X(x3), Y(y3) )
 cx.lineTo( X(x4), Y(y4) )
 cx.lineTo( X(x5), Y(y5) )
 cx.lineTo( X(x6), Y(y6) )
 cx.lineTo( X(x7), Y(y7) )
 cx.lineTo( X(x8), Y(y8) )
 cx.lineTo( X(x9), Y(y9) )
 cx.stroke()
 cx.beginPath()
 cx.strokeStyle="brown"
 cx.lineWidth=1
 for (i=1;i<=4;i++) {x=i; cx.moveTo( X(x),Y(-1) ); cx.lineTo( X(x),Y(5) ) }
 for (i=1;i<=4;i++) {y=i; cx.moveTo( X(-1),Y(y) ); cx.lineTo( X(5),Y(y) ) }
 cx.stroke()
|
•• Come colorare il poligono: vedi poligo3b
•• How to color the polygon: see poligo3b
  ...
  cx.beginPath()
  cx.fillStyle="yellow"
  cx.strokeStyle="blue"
  cx.moveTo( X(x1), Y(y1) )
  ...
  cx.lineTo( X(x9), Y(y9) )
  cx.fill()
  cx.stroke()
|
|  |
•• Invece di usare x1,y1, x2,y2, …, x9,y9
posso usare le variabili indiciate (o array) xp e yp
(xp[0],yp[0], xp[1],yp[1], …, xp[8],yp[8]);
in xp.length ho la lunghezza di xp (il primo indice è sempre 0).
Vedi poligo3c
•• Instead of using x1,y1, x2,y2, …, x9,y9
I can use the indexed variables (or arrays) xp and yp (xp[0],yp [0], xp[1],yp[1], …, xp[8],yp[8]);
in xp.length I have the length of xp (the first index is always 0).
See poligo3c
  ...
  cx.fillStyle="yellow"
  cx.strokeStyle="blue"
  xp = [0.5, 1, 4, 4.5, 3, 4.5, 4.5,   2,   0, 0.5]
  yp = [0,   0, 1, 2.5, 3, 3.5, 3.5, 4.5, 2.5, 0  ]
  np = xp.length
  cx.moveTo( X(xp[0]), Y(yp[0]) ); for(i=1; i<=np-1; i++) {cx.lineTo( X(xp[i]), Y(yp[i]) )}
  cx.fill()
  cx.stroke()
Invece di x = [ ... ] potrei usare
x = new Array ( ... ).
Se in un programma non mettessi direttamente i valori in una variabile indiciata x, prima di usarla dovrei "dichiararla" col comando x = [ ].
Instead of x = [ ... ] I could use
x = new Array ( ... ).
If in a program I didn't put the values directly into an indexed variable x, before using it I would have to "declare" it with the command x = [ ].
•• Posso inserire dei valori in una variabile indiciata
anche non direttamente, ad esempio con un ciclo "for". Un esempio e le uscite. Vedi ind_var.
•• I can insert values in an indexed variable that
are not directly indicated, for example with a "for" loop. An example and the outputs. See ind_var.
<script> Q=[]; for(i=0; i<=10; i=i+1) {Q[i] = 15+5*i}
         for(i=0; i<=10; i=i+1) { document.write(Q[i]+" ") } </script>
15 20 25 30 35 40 45 50 55 60 65
o / or (vedi / see ind_var2):
<script> Q=[]; k=0; for(j=15; j<=65; j=j+5) {Q[k] = j; k=k+1}
         for(j=0; j<k; j=j+1) { document.write(Q[j]+" ") } </script>
15 20 25 30 35 40 45 50 55 60 65
<canvas width="400" height="400"></canvas>
<script> with(Math) {

xp = [-10, -10,   5, 5, -10]
yp = [  5, -10, -10, 5,   5]
xC = -2.5; yC = -2.5
R=7.5

Width=400; Height=400                              // <-- change
minX=-16; maxX=11; minY=-16; maxY=11

Mx=Width/(maxX-minX)
My=Height/(maxY-minY)    // for the same scale take  My=Mx
B=(0-minX)*Width/(maxX-minX); H=(maxY-0)*Height/(maxY-minY)
function X(a) {return B+a*Mx}; function Y(b) {return H-b*My}

 let cx = document.querySelector("canvas").getContext("2d");
 cx.beginPath()
 cx.lineWidth=3
 cx.strokeStyle="blue"
 cx.moveTo( X(xp[0]), Y(yp[0]) ); for(i=1; i<=4; i++) {cx.lineTo( X(xp[i]), Y(yp[i]) )}
 cx.stroke()
 cx.beginPath()
 cx.strokeStyle="brown"
 cx.lineWidth=5
 cx.moveTo( X(-16), Y(0) )  /// asse x da -16 a 11
 cx.lineTo( X(11),  Y(0) )
 cx.moveTo( X(0), Y(-16) )   /// asse y da -16 a 11
 cx.lineTo( X(0),  Y(11) )
 cx.stroke()
 cx.beginPath()
 cx.lineWidth=3
 cx.strokeStyle="green"
 cx.arc( X(xC), Y(yC), R*Mx, 0, 2*PI);
 cx.stroke()
 cx.beginPath()
 cx.lineWidth=1
 cx.strokeStyle="black"
 for(i=-3; i<=2; i++) { y=5*i; cx.moveTo( X(-16), Y(y) ); cx.lineTo( X(11), Y(y) ) }
 for(i=-3; i<=2; i++) { x=5*i; cx.moveTo( X(x), Y(-16) ); cx.lineTo( X(x), Y(11) ) }
 cx.stroke()
 cx.beginPath(); cx.strokeStyle="red"; cx.lineWidth=3
 cx.strokeRect ( X(xC)-2, Y(yC)-2, 4, 4 )
 cx.stroke()

} </script>
| |
•• Come ottenere la figura seguente (non tutta nel 1º quadrante), con poligo4:
•• How to obtain the following figure (not all in the 1st quadrant), with poligo4:
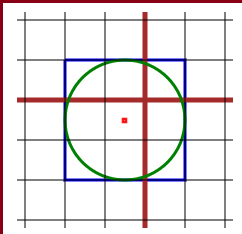
Viene impiegato un ciclo for.
Con cx.arc(...) vengono tracciati cerchi o archi di cerchio.
cx.strokeRect(...) traccia un rettangolo dando le coordinate di un punto schermo e le ampiezze dei lati.
A for loop is used.
With cx.arc(...) circles or circle arcs are drawn.
cx.strokeRect(...) draws a rectangle, giving the coordinates of a screen point and the widths of the sides.
Per usare particolari costanti e funzioni (PI, abs, …) dopo <script> si mette with(Math){ e prima di </script> si mette }:
vedi qui.
To use particular constants and functions (PI, abs, …) after <script> we put with(Math){ and
before </script> we put }: see here.
|
Ma il browser Safari ha "strani" comportamenti di fronte ai nomi di funzioni e costanti predefinite, per cui, se si vuole che i
file operino anche con Safari, conviene non usare "with(Math)" e far precedere i loro nomi da "Math.". Vedi gli esempi seguenti.
But the Safari browser has "strange" behavior in front of the names of predefined functions and constants,
so if you want the files to work with Safari as well,
don't use "with (Math)" and prefix their names with " Math.". See the examples below.
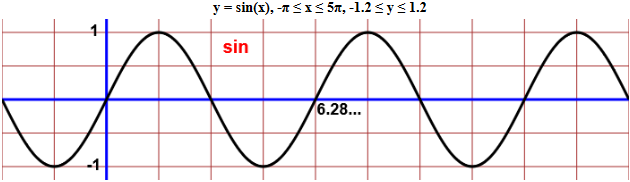
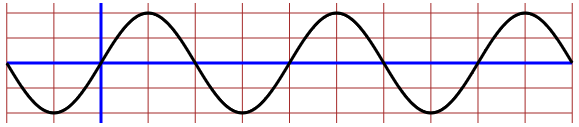
•• Come ottenere il grafico di una funzione (usando due moltiplicatori diversi per le ascisse e le ordinate, per
usare una scala non monometrica), la funzione "seno" (vedi poligo5):
•• How to obtain the graph of a function (using two different multipliers for the abscissas and ordinates, to use a non-monometric scale), the "sine" function (see poligo5):
<canvas width="700" height="200"></canvas>
<script>
Width=700; Height=200                            // <-- change
minX=-Math.PI; maxX=5*Math.PI; minY=-1.2; maxY=1.2

Mx=Width/(maxX-minX)
My=Height/(maxY-minY)  // for the same scale take  My=Mx
B=(0-minX)*Width/(maxX-minX); H=(maxY-0)*Height/(maxY-minY)
function X(a) {return B+a*Mx}; function Y(b) {return H-b*My}

x1=-Math.PI; x2=5*Math.PI; n=1000; Dx=Math.PI/2; Dy=0.5; y1=-1.2; y2=1.2
let cx = document.querySelector("canvas").getContext("2d");
cx.beginPath(); cx.lineWidth=1; cx.strokeStyle="brown"
for (i=-2; i<=10; i++) { x=Dx*i; cx.moveTo( X(x), Y(y1) ); cx.lineTo( X(x), Y(y2) ) }
for (i=-2; i<=2; i++) { y=Dy*i; cx.moveTo( X(x1), Y(y) ); cx.lineTo( X(x2), Y(y) ) }
cx.stroke()
cx.beginPath(); cx.lineWidth=3; cx.strokeStyle="blue"
cx.moveTo( X(x1), Y(0) ); cx.lineTo( X(x2), Y(0) )
cx.moveTo( X(0), Y(-1.2) ); cx.lineTo( X(0), Y(1.2) )
cx.stroke()
cx.beginPath(); cx.lineWidth=3; cx.strokeStyle="black"
x=x1; y=Math.sin(x)
cx.moveTo(B + x*Mx,H - y*My)
for (i=0; i<=n; i++) { x=x1+(x2-x1)/n*i; y=Math.sin(x); cx.lineTo( X(x), Y(y) ) }
cx.stroke()
</script>
Se voglio posso aggiungere una scritta prima del grafico aggiungendo in testa una frase tra <p> e </p> o, come fatto sotto, con una "table", che posso dimensionare specificando la "width" (≥ la "width" di "canvas"). Posso aggiungere delle scritte anche nel grafico. Vedi poligo5B.
If I want I can add a text before the graph by adding, at the top, a sentence between <p> and </p> or, as done below, with a "table", which I can size by specifying the "width" (≥ the "width" of "canvas"). I can also add some writing inside the graph. See poligo5B.
<table width=710><tr align=center><td><b>y = sin(x), -PI <= x <= 5PI, -1.2 <= y <= 1.2</b></td></tr></table>
<canvas width="700" height="180"></canvas>
<script>
Width=700; Height=180
...
cx.fillStyle = "red"; cx.font = "bold 20px Arial"; cx.fillText("sin", X(3.5), Y(0.7) )
cx.fillStyle = "black"; cx.font = "bold 18px Arial"; cx.fillText( 1, X(-0.5), Y(0.95) )
cx.fillText(-1, X(-0.6), Y(-1.05) )
cx.fillText( "6.28...", X(6.32), Y(-0.23) )

</script>
•• Posso ottenere anche il grafico in forma animata usando opportunamente il
comando requestAnimationFrame (vedi poligo5C).
•• I can also get the graph in animated form using the requestAnimationFrame command appropriately (see poligo5C). [if you employ a Mac, don't use Safari but another browser]
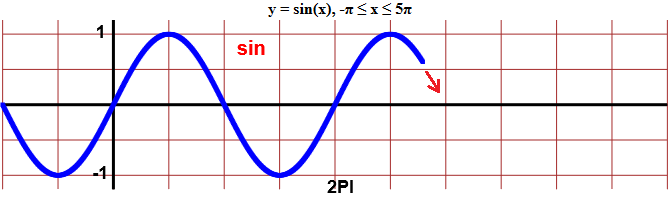
<table width=710><tr align=center><td><b>y = sin(x), x in [-PI, 5PI]</b></td></tr></table>
<canvas width="700" height="180"></canvas>
<script>
Width=700; Height=180                                // <-- change
minX=-Math.PI-0.5; maxX=5*Math.PI+0.5; minY=-1.35; maxY=1.2
Mx=Width/(maxX-minX)
My=Height/(maxY-minY)  // per un sistema monometrico prendi / for the same scale take  My=Mx
B=(0-minX)*Width/(maxX-minX); H=(maxY-0)*Height/(maxY-minY)
function X(a) {return B+a*Mx}; function Y(b) {return H-b*My}
x1=-Math.PI; x2=5*Math.PI; n=1000; Dx=Math.PI/2; Dy=0.5; y1=-1.2; y2=1.2
let cx = document.querySelector("canvas").getContext("2d");
cx.beginPath(); cx.lineWidth=1; cx.strokeStyle="brown"
for (i=-2; i<=10; i++) { x=Dx*i; cx.moveTo( X(x), Y(y1) ); cx.lineTo( X(x), Y(y2) ) }
for (i=-2; i<=2; i++) { y=Dy*i; cx.moveTo( X(x1), Y(y) ); cx.lineTo( X(x2), Y(y) ) }
cx.stroke()
cx.beginPath(); cx.lineWidth=3; cx.strokeStyle="black"
cx.moveTo( X(x1), Y(0) ); cx.lineTo( X(x2), Y(0) )
cx.moveTo( X(0), Y(-1.2) ); cx.lineTo( X(0), Y(1.2) )
cx.fillStyle = "red"; cx.font = "bold 20px Arial"; cx.fillText("sin", X(3.5), Y(0.7) )
cx.fillStyle = "black"; cx.font = "bold 18px Arial"; cx.fillText( 1, X(-0.5), Y(0.95) );
cx.fillText(-1, X(-0.6), Y(-1.05) );
cx.stroke()
cx.beginPath(); cx.strokeStyle="blue"
i=0; TX=0; x=x1
function anima(t, t0) {if(x <= x2) {x=x1+(x2-x1)/n*i; y=Math.sin(x); i=i+1}
         cx.strokeRect( X(x)-0.7, Y(y)-0.7, 1.4, 1.4)
         if (x > 2*Math.PI-0.3 && TX==0) {cx.fillText("2PI", X(x), Y(-1.25) ); TX=1}
         if (x > 4*Math.PI-0.3 && TX==1) {cx.fillText("4PI", X(x), Y(-1.25) ); TX=2}
         requestAnimationFrame( t1 => anima(t1,t) )   }
requestAnimationFrame(anima)
cx.stroke()
</script>
"requestAnimationFrame" imposta una animazione F (che qui abbiamo denominato "anima").
F usa a sua volta "requestAnimationFrame" per stabilire la scadenza del successivo aggiornamento: "requestAnimationFrame" a t1 associa ricorsivamente F(t1,t).
Tra un aggiornamento e l'altro passa circa 1/60 di secondo.
"requestAnimationFrame" sets up an animation F (which we have named "anima" here).
F in turn uses "requestAnimationFrame" to establish the expiration of the next update: "requestAnimationFrame" to t1 recursively associates F (t1,t).
Approximately 1/60 of a second passes between one update and another.
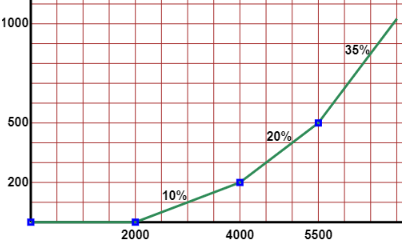
•• Le scritte nel grafico, inserite con "cx.fillText(...,x,y)",
vengono collocate immediatamente a destra e sopra il punto (x,y). Posso disporle diversamente con i comandi
"cx.textAlign" (con ="center", ="right" o ="left")
e "cx.textBaseline" (con ="middle", ="top" o ="bottom").
Vedi tax_1.
•• The writings in the graph, inserted with "cx.fillText(...,x,y)",
are placed immediately to the right and above the point (x,y). I can arrange them differently with the commands
"cx.textAlign" (with ="center", ="right" or ="left")
and "cx.textBaseline" (with ="top", ="middle" or ="bottom").
See tax_1.
<canvas width="500" height="300"></canvas>
<script>
Width=500; Height=300         // <-- dim of image (change if you want)

R = [ 0, 2000, 4000, 5500, 7000]
I = [ 0,    0,  200,  500, 1025]
np = R.length   //  R[0],I[0], ..., R[np-1],I[np-1]

sX=700; sY=100                               // left and down space: you can change
aX=0; maxX=7100; aY=0; maxY=1120
minX = aX-sX; minY = aY-sY

Dx=500; nx=14; Dy=100; ny=11

Mx=Width/(maxX-minX)
My=Height/(maxY-minY)  // per un sistema monometrico prendi / for the same scale take  My=Mx
B=(0-minX)*Width/(maxX-minX); H=(maxY-0)*Height/(maxY-minY)

function X(a) {return B+a*Mx}; function Y(b) {return H-b*My}

let cx = document.querySelector("canvas").getContext("2d");
cx.beginPath(); cx.lineWidth=1; cx.strokeStyle="brown"
for (i=0; i<=nx; i++) { x=Dx*i; cx.moveTo( X(x), Y(0) ); cx.lineTo( X(x), Y(maxY) ) }
for (i=0; i<=ny; i++) { y=Dy*i; cx.moveTo( X(0), Y(y) ); cx.lineTo( X(maxX), Y(y) ) }
cx.stroke()
cx.beginPath(); cx.lineWidth=3; cx.strokeStyle="black"
cx.moveTo( X(0), Y(0) ); cx.lineTo( X(0), Y(maxY) )
cx.moveTo( X(0), Y(0) ); cx.lineTo( X(maxX), Y(0) )
cx.textAlign="center"; cx.font = "bold 16px Arial"; cx.textBaseline="top"
cx.fillText( 2000, X(2000), Y(aY)+5 ); cx.fillText( 4000, X(4000), Y(aY)+5 ); cx.fillText( 5500, X(5500), Y(aY)+5 )
cx.textBaseline="bottom"
cx.fillText( "10%", X(2750), Y(110) ); cx.fillText( "20%", X(4750), Y(410) ); cx.fillText( "35%", X(6250), Y(845) )
cx.textAlign="right"; cx.textBaseline="middle"
cx.fillText( 200, X(aX)-5, Y(200) ); cx.fillText( 500, X(aX)-5, Y(500) ); cx.fillText( 1000, X(aX)-5, Y(1000) )
cx.stroke()
cx.beginPath(); cx.lineWidth=3; cx.strokeStyle="seagreen"
cx.moveTo( X( R[0] ), Y( I[0] ) ); for(i=1; i<=np-1; i++) { cx.lineTo( X( R[i] ), Y( I[i] ) ) }
cx.stroke()
cx.beginPath(); cx.lineWidth=3; cx.strokeStyle="blue"
for(i=0; i<=np-2; i++) { cx.strokeRect ( X(R[i])-3, Y(I[i])-3, 6, 6 ) }
cx.stroke()
</script>
• • Altri esempi qui
/ other examples here.
• • e qui
/ and here.
•• Un altro esempio: il cerchio che passa per 3 punti,
(individuato con lo script circle): vedi circle_1.
•• Another example: the circle that passes through 3 points,
(identified with the script circle): see circle_1.
<table width=310><tr><td align=center>
<b>P1 = (0,2), P2 = (-1,0), P3 = (1,1)</b>
</td></tr></table>

<canvas width="300" height="300"></canvas>
<script>

R=Math.sqrt(25/18); xC=-1/6; yC = 5/6
X1=0; Y1=2; X2=1; Y2=1; X3=-1; Y3=0

Width=300; Height=300      // <-- dim of image (change if you want)
sX=0.5; sY=0.5                          // left and down space: you can change
aX = -2; bX = 2; aY = -1; bY = 3
minX = aX-sX; maxX = bX; minY = aY-sY; maxY = bY

Dx=0.5; nx=9; Dy=0.5; ny=9 | 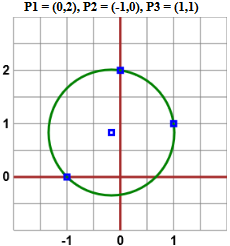 |
Mx=Width/(maxX-minX)
My=Mx          // per un sistema monometrico prendi / for the same scale take  My=Mx
B=(0-minX)*Width/(maxX-minX); H=(maxY-0)*Height/(maxY-minY)
function X(a) {return B+a*Mx}; function Y(b) {return H-b*My}

let cx = document.querySelector("canvas").getContext("2d");

cx.beginPath(); cx.lineWidth=1; cx.strokeStyle="grey"          /// grid
for (i=0; i<=nx; i++) { x =  aX+Dx*i; cx.moveTo( X(x), Y(aY) ); cx.lineTo( X(x), Y(bY) ) }
for (i=0; i<=ny; i++) { y =  aY+Dy*i; cx.moveTo( X(aX), Y(y) ); cx.lineTo( X(bX), Y(y) ) }
cx.stroke()
cx.beginPath(); cx.lineWidth=3; cx.strokeStyle="brown"          /// axes
cx.moveTo( X(aX), Y(0) ); cx.lineTo( X(bX), Y(0) )
cx.moveTo( X(0), Y(aY) ); cx.lineTo( X(0), Y(bY) )
cx.stroke()
cx.beginPath(); cx.lineWidth=3; cx.strokeStyle="green"
 cx.arc( X(xC), Y(yC), R*Mx, 0, 2*Math.PI);
cx.stroke()
cx.beginPath(); cx.lineWidth=3; cx.strokeStyle="blue"
 cx.strokeRect ( X(X1)-3, Y(Y1)-3, 6, 6 ); cx.strokeRect ( X(X2)-3, Y(Y2)-3, 6, 6 ); cx.strokeRect ( X(X3)-3, Y(Y3)-3, 6, 6 )
 cx.strokeRect ( X(xC)-3, Y(yC)-3, 6, 6 )
cx.stroke()
cx.beginPath(); cx.textAlign="center"; cx.textBaseline="top", cx.font = "bold 16px Arial"
 cx.fillText( 0, X(0), Y(aY)+5 ); cx.fillText( 1, X(1), Y(aY)+5 ); cx.fillText( -1, X(-1), Y(aY)+5 )
 cx.textAlign="right"; cx.textBaseline="middle"
 cx.fillText( 0, X(aX)-5, Y(0) ); cx.fillText( 1, X(aX)-5, Y(1) ); cx.fillText( 2, X(aX)-5, Y(2) )
cx.stroke()
</script>
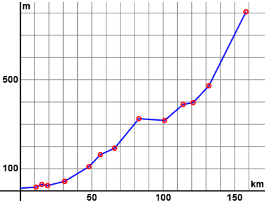
•• Il grafico di una funzione (eventualmente dopo averne trovato
massimo e minimo tra -3 e 3: vedi qui):
vedi maxmin_f.
•• The graph of a function (possibly after having found
maximum and minimum between -3 and 3: see here):
see maxmin_f.
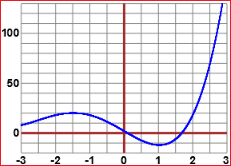
<table width=460><tr><td align=center><b>f(x) = x^4 + 5*x^3 - 20*x + 2
</b></td></tr></table>

<canvas width="460" height="300"></canvas>
<script>

function f(x) { return Math.pow(x,4)+5*Math.pow(x,3)-20*x+2 }

Width=450; Height=300         // <-- dim of image (change if you want)
sX=0.5; sY=10                               // left and down space: you can change
aX = -3; bX = 3; aY = -20; bY = 130
minX = aX-sX; maxX = bX; minY = aY-sY; maxY = bY+0.5

n=8*9*5*7*11

Dx=0.5; nx=12; Dy=10; ny=18

Mx=Width/(maxX-minX)
My=Height/(maxY-minY)          // per un sistema monometrico prendi / for the same scale take  My=Mx
B=(0-minX)*Width/(maxX-minX); H=(maxY-0)*Height/(maxY-minY)
function X(a) {return B+a*Mx}; function Y(b) {return H-b*My}

let cx = document.querySelector("canvas").getContext("2d");

cx.beginPath(); cx.lineWidth=1; cx.strokeStyle="grey"          /// grid
for (i=0; i<=nx; i++) { x =  aX+Dx*i; cx.moveTo( X(x), Y(aY) ); cx.lineTo( X(x), Y(bY) ) }
for (i=0; i<=ny; i++) { y =  aY+Dy*i; cx.moveTo( X(aX), Y(y) ); cx.lineTo( X(bX), Y(y) ) }
cx.stroke()
cx.beginPath(); cx.lineWidth=3; cx.strokeStyle="brown"          /// axes
cx.moveTo( X(aX), Y(0) ); cx.lineTo( X(bX), Y(0) )
cx.moveTo( X(0), Y(aY) ); cx.lineTo( X(0), Y(bY) )
cx.stroke()

cx.beginPath(); cx.lineWidth=1; cx.strokeStyle="blue"
 for (i=0; i<=n; i++) { x=minX+(maxX-minX)/n*i; y=f(x);
       if(y<=bY && y>=aY && x<=bX && x>=aX) {cx.strokeRect( X(x)-0.1, Y(y)-0.1, 0.2, 0.2) } }
cx.stroke()

cx.beginPath(); cx.textAlign="center"; cx.textBaseline="top", cx.font = "bold 16px Arial"
 cx.fillText( 0, X(0), Y(aY)+5 ); cx.fillText( 1, X(1), Y(aY)+5 ); cx.fillText( -2, X(-2), Y(aY)+5 )
 cx.fillText( 3, X(3), Y(aY)+5 ); cx.fillText( -1, X(-1), Y(aY)+5 ); cx.fillText( -3, X(-3), Y(aY)+5 )
 cx.fillText( 2, X(2), Y(aY)+5 )

 cx.textAlign="right"; cx.textBaseline="middle"
 cx.fillText( 0, X(aX)-5, Y(0) ); cx.fillText( 50, X(aX)-5, Y(50) ); cx.fillText( 100, X(aX)-5, Y(100) )
cx.stroke()

</script>
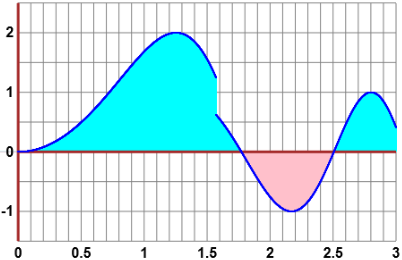
••
∫[0,3] F where F(x) = 2·sin(x²) if x ≤ π/2, F(x) = sin(x²) if x > π/2.
The graph (see integ2) :
Part of the code:
 ...
function f(x) { if(x<=Math.PI/2) {u=2*Math.sin(x*x)} else {u=Math.sin(x*x)}; return u }
 ...
cx.beginPath(); cx.lineWidth=1; cx.strokeStyle="cyan"
 for (i=0; i<=n; i++) { x=minX+(maxX-minX)/n*i; y=f(x);
       if(y > 0 && y<=bY && y>=aY && x<=bX && x>= aX)
         cx.moveTo(X(x),Y(y)); cx.lineTo(X(x),Y(0))  }
cx.stroke()

cx.beginPath(); cx.lineWidth=1; cx.strokeStyle="pink"
 for (i=0; i<=n; i++) { x=minX+(maxX-minX)/n*i; y=f(x);
       if(y < 0 && y<=bY && y>=aY && x<=bX && x>= aX)
         cx.moveTo(X(x),Y(y)); cx.lineTo(X(x),Y(0))  }
cx.stroke()
 ...
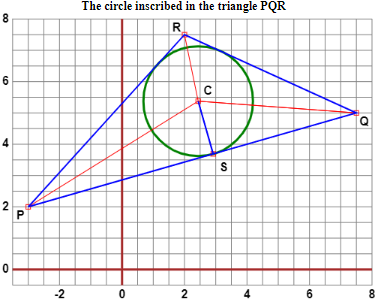
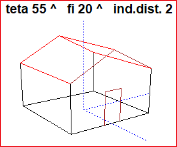
•• P = (-3, 2), Q = (7.5, 5), R = (2, 7.5).
Come tracciare il cerchio inscritto nel triangolo PQR?
See example_fig (vedi il codice,
vedi come studiare il triangolo):
•• P = (-3, 2), Q = (7.5, 5), R = (2, 7.5).
How can I trace the circle inscribed in the triangle PQR?
See example_fig
(see the code,
see how to study the triangle):
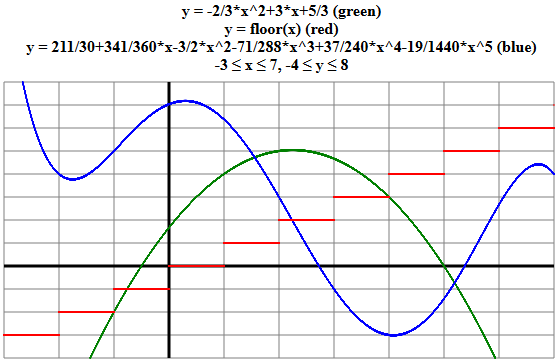
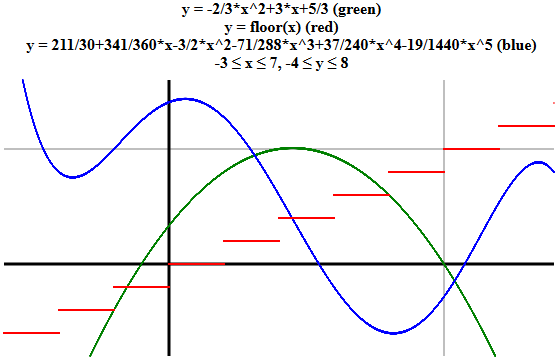
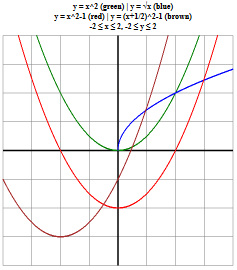
•• Come ottenere il grafico di più funzioni, anche non continue, e con parti che uscirebbero dal riquadro scelto (vedi poligo6).
•• How to get the graph of several functions, even if not continuous, and with parts that would come out of the chosen box (see poligo6).
<table width=600><tr align=center><td><b>
y = -2/3*x^2+3*x+5/3 (green)<br>y = floor(x) (red)<br>
y = 211/30+341/360*x-3/2*x^2-71/288*x^3+37/240*x^4-19/1440*x^5 (blue)<br>
-3 ≤ x ≤ 7, -4 ≤ y ≤ 8
</b></td></tr></table>
<canvas width="600" height="300"></canvas>
<script>
function f1(x) { return -2/3*Math.pow(x,2)+3*x+5/3 }
function f2(x) {return 211/30+341/360*x-3/2*Math.pow(x,2)-71/288*Math.pow(x,3)+37/240*Math.pow(x,4)-19/1440*Math.pow(x,5)}
function f3(x) {return Math.floor(x)}

Width=600; Height=300                               // <-- change
minX=-3; maxX=7; minY=-4; maxY=8

Mx=Width/(maxX-minX)
My=Height/(maxY-minY)           // for the same scale take  My=Mx
B=(0-minX)*Width/(maxX-minX); H=(maxY-0)*Height/(maxY-minY)
function X(a) {return B+a*Mx}; function Y(b) {return H-b*My}

x1=-3; x2=7; Dx=1; Dy=1; y1=-4; y2=8
let cx = document.querySelector("canvas").getContext("2d");
n=8*9*5*7*11
cx.beginPath(); cx.lineWidth=1; cx.strokeStyle="grey"          /// grid
for (i=-3; i<=7; i++) { x=Dx*i; cx.moveTo( X(x), Y(y1) ); cx.lineTo( X(x), Y(y2) ) }
for (i=-4; i<=8; i++) { y=Dy*i; cx.moveTo( X(x1), Y(y) ); cx.lineTo( X(x2), Y(y) ) }
cx.stroke()
cx.beginPath(); cx.lineWidth=3; cx.strokeStyle="black"         /// axes
cx.moveTo( X(x1), Y(0) ); cx.lineTo( X(x2), Y(0) )
cx.moveTo( X(0), Y(y1) ); cx.lineTo( X(0), Y(y2) )
cx.stroke()
cx.beginPath(); cx.lineWidth=1; cx.strokeStyle="green"
for (i=0; i<=n; i++) { x=x1+(x2-x1)/n*i; y=f1(x);
       if(y<=y2 && y>=y1) {cx.strokeRect( X(x)-0.2, Y(y)-0.2, 0.4, 0.4) } }
cx.stroke()
cx.beginPath(); cx.lineWidth=1; cx.strokeStyle="blue"
for (i=0; i<=n; i++) { x=x1+(x2-x1)/n*i; y=f2(x);
       if(y<=y2 && y>=y1) {cx.strokeRect( X(x)-0.2, Y(y)-0.2, 0.4, 0.4) } }
cx.stroke()
cx.stroke()
cx.beginPath(); cx.lineWidth=1; cx.strokeStyle="red"
for (i=0; i<=n; i++) { x=x1+(x2-x1)/n*i; y=f3(x);
       if(y<=y2 && y>=y1) {cx.strokeRect( X(x)-0.2, Y(y)-0.2, 0.4, 0.4) } }
cx.stroke()
</script>
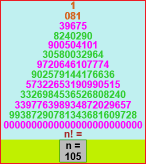
I punti li abbiamo tracciati come rettangolini con "cx.strokeRect". Abbiamo preso n = 8*9*5*7*11 (numero dei punti tracciati)
in modo da avere un numero grande e divisibile per vari numeri interi.
We have drawn the points as rectangles with "cx.strokeRect".
We have chosen n = 8*9*5*7*11 (number of plotted points) in order to have a high number divisible by various integers in common use.
Se voglio cambiare la griglia (vedi poligo7) / If
I want to change the grid (see poligo7):
. . .
x1=-3; x2=7; Dx=5; Dy=5; y1=-4; y2=8
. . .
for (i=0; i<=1; i++) { x=Dx*i; cx.moveTo( X(x), Y(y1) ); cx.lineTo( X(x), Y(y2) ) }
for (i=0; i<=1; i++) { y=Dy*i; cx.moveTo( X(x1), Y(y) ); cx.lineTo( X(x2), Y(y) ) }
. . .
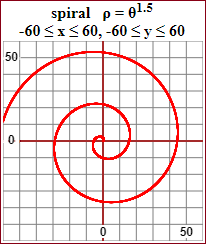
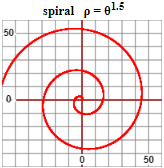
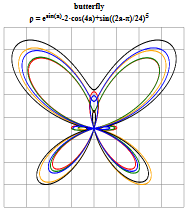
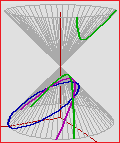
•• Vediamo come tracciare una curva descritta in forma parametrica o polare,
esaminando lo script spiral:
•• Let's see how to draw a curve described in parametric or polar form by examining the
spiral script:
<title>spiral</title>
<table width=400><tr><td align=center><b>spiral ρ = θ<sup>1.5</sup><br>
-60 ≤ x ≤ 60, -60 ≤ y ≤ 60<br></b></td></tr></table>
<canvas width="400" height="400"></canvas>
<script>
function r(a) { return Math.pow(a,1.5) }
function f1(a) { return Math.cos(a)*r(a) }
function f2(a) { return Math.sin(a)*r(a) }
Width=400; Height=400
minX=-60; maxX=60; minY=-60; maxY=60
Mx=Width/(maxX-minX)
My=Mx // per un sistema monometrico prendi / for the same scale take My=Mx
B=(0-minX)*Width/(maxX-minX); H=(maxY-0)*Height/(maxY-minY)
function X(a) {return B+a*Mx}; function Y(b) {return H-b*My}
t1=0; t2=5*Math.PI; x1=-60; x2=60; Dx=10; Dy=10; y1=-60; y2=60
let cx = document.querySelector("canvas").getContext("2d");
n=8*9*5*7*11
cx.beginPath(); cx.lineWidth=1; cx.strokeStyle="grey" /// grid
for (i=-6; i<=6; i++) { x=Dx*i; cx.moveTo( X(x), Y(y1) ); cx.lineTo( X(x), Y(y2) ) }
for (i=-6; i<=6; i++) { y=Dy*i; cx.moveTo( X(x1), Y(y) ); cx.lineTo( X(x2), Y(y) ) }
cx.stroke()
cx.beginPath(); cx.lineWidth=2; cx.strokeStyle="brown" /// axes
cx.moveTo( X(x1), Y(0) ); cx.lineTo( X(x2), Y(0) )
cx.moveTo( X(0), Y(y1) ); cx.lineTo( X(0), Y(y2) )
cx.stroke()
cx.beginPath(); cx.lineWidth=1; cx.strokeStyle="red"
for (i=0; i<=n; i++) { t=t1+(t2-t1)/n*i; x=f1(t); y=f2(t)
if(y<=y2 && y>=y1 && x<=x2 && x>=x1) {cx.strokeRect( X(x)-0.2,Y(y)-0.2, 0.4,0.4)} }
cx.stroke()
</script>
| |  |
Le scritte all'interno del grafico sono state inserite cancellando prima
parte della griglia con delle scritte bianche:
The writings inside the graph have been inserted by deleting, first, part of the grid with white writings:
cx.beginPath(); cx.textAlign="center"; cx.textBaseline="middle"
 cx.font = "bold 20px Arial"; cx.fillStyle="white"
  cx.fillText( "I", X(0), Y(-55)); cx.fillText( "I", X(50), Y(-55))
  cx.fillText( "---", X(-55), Y(0)); cx.fillText( "---", X(-55), Y(50))
 cx.font = "bold 16px Arial"; cx.fillStyle="black"
  cx.fillText( 0, X(0), Y(-55)); cx.fillText( 50, X(50), Y(-55));
  cx.fillText( 0, X(-55), Y(0)); cx.fillText( 50, X(-55), Y(50))
cx.stroke()
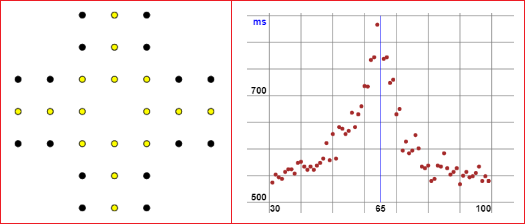
•• Un altro tipo di grafico: una serie di diagrammi a striscia: hours_light.
Osserviamo come mettere delle scritte subito sotto al grafico con un'altra "table" sotto a "canvas".
E vediamo come una "function" può essere usata, oltre che per calcolare un valore, per comandare l'esecuzione di alcuni comandi.
••
Another type of chart: a series of strip charts: hours_light. Let's observe how to put some writing immediately below the graph with another "table" under "canvas". And let's see how a "function" can be used, as well as to calculate a value, to command the execution of some commands.
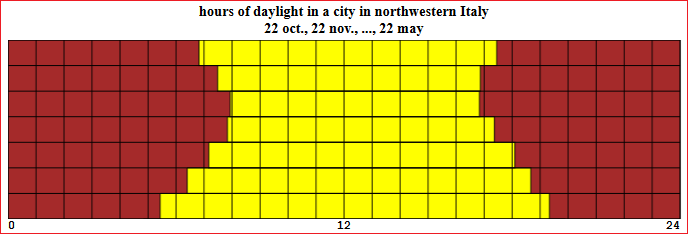
<table width=750><tr align=center><td><b>hours of daylight in a city in northwestern Italy<br>22 oct., 22 nov., ..., 22 may</b></td></tr></table>
<canvas width=750 height=200></canvas>
<table width=750 cellpadding=0 cellspacing=0>
<tr><td align=left><pre><b>0 </b></pre></td><td align=center><pre><b>12</b></pre></td><td align=right><pre><b>24</b></pre></td></tr>
</table>

<script>
Width=750; Height=200
minX=0; maxX=24; minY=0; maxY=7

Mx = Width/(maxX-minX)
My = Height/(maxY-minY)  // per un sistema monometrico prendi / for the same scale take  My=Mx
B=(0-minX)*Width/(maxX-minX); H=(maxY-0)*Height/(maxY-minY)
function X(a) {return B+a*Mx}; function Y(b) {return H-b*My}

let cx = document.querySelector("canvas").getContext("2d")
cx.beginPath(); cx.lineWidth=1; cx.strokeStyle="black"; cx.fillStyle="brown"
cx.moveTo(X(0),Y(0)); cx.lineTo(X(0),Y(7)); cx.lineTo(X(24),Y(7)); cx.lineTo(X(24),Y(0)); cx.lineTo(X(0),Y(0))
cx.fill(); cx.stroke()

function L(i,a,b) { cx.moveTo(X(a),Y(i)); cx.lineTo(X(a),Y(i-1)); cx.lineTo(X(b),Y(i-1)); cx.lineTo(X(b),Y(i)); cx.lineTo(X(a),Y(i)) }

cx.beginPath(); cx.lineWidth=1; cx.strokeStyle="black"; cx.fillStyle="yellow"
L(7,6+49/60,17+27/60); L(6,7+29/60,16+52/60); L(5,7+56/60,16+50/60); L(4,7+50/60,17+22/60);
L(3,7+10/60,18+6/60); L(2,6+24/60,18+40/60); L(1,5+26/60,19+20/60); L(0,4+49/60,19+53/60)
cx.fill(); cx.stroke()

cx.beginPath(); cx.lineWidth=1; cx.strokeStyle="black"
for(i=0; i<=24; i=i+1) { cx.moveTo( X(i),Y(0) );   cx.lineTo( X(i),Y(7) ) }
for(i=0; i<=7; i=i+1) { cx.moveTo( X(0),Y(i) );   cx.lineTo( X(24),Y(i) ) }
cx.stroke()
</script>
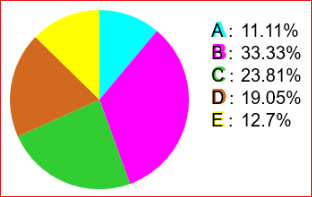
•• Per ottenere la rappresentazione come diagramma a torta e come distribuzione
percentuale dei seguenti dati: 7, 21, 15, 12, 8, puoi usare lo script torta:
•• To get the pie chart representation and percentage distribution of the following data: 7, 21, 15, 12, 8, you can use this script (see torta):
<canvas width="600" height="300"></canvas>
<script>
n = 5

A = 7
B = 21
C = 15
D = 12
E = 8
F = 0
G = 0
H = 0
I = 0
J = 0
K = 0

var results = [
  {name: "A", count: A, color: "cyan"},
  {name: "B", count: B, color: "magenta"},
  {name: "C", count: C, color: "limegreen"},
  {name: "D", count: D, color: "chocolate"},
  {name: "E", count: E, color: "yellow"},
  {name: "F", count: F, color: "royalblue"},
  {name: "G", count: G, color: "red"},
  {name: "H", count: H, color: "seagreen"},
  {name: "I", count: I, color: "pink"},
  {name: "J", count: J, color: "grey"},
  {name: "K", count: K, color: "coral"}
];

  let cx = document.querySelector("canvas").getContext("2d");
  let total = results
    .reduce((sum, {count}) => sum + count, 0);
  let currentAngle = -0.5 * PI;
  let centerX = 120, centerY = 120;
  r=1
  for (let result of results) {
    if(r<=n) {
    let sliceAngle = (result.count / total) * 2 * PI;
    p = result.count / total
    p = Math.round(p*10000)/100
    cx.beginPath();
    cx.arc(centerX, centerY, 100,
           currentAngle, currentAngle + sliceAngle);
    currentAngle += sliceAngle;
    cx.lineTo(centerX, centerY);
    cx.fillStyle = result.color;
    cx.fill();
    cx.font = "bold 24px Arial";
    cx.fillText(result.name,245,25+25*r);
    cx.fillStyle = "black";
    cx.font = "20px Arial";
    cx.fillText(result.name+" :",245,25+25*r);
    cx.fillText(p+"%",278,25+25*r);
    r = r+1
  }}
</script>
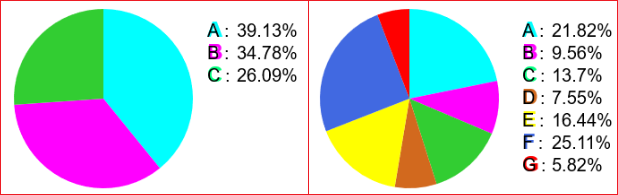
Per un altro diagramma devi cambiare le righe tra n = e K = .
For another diagram you need to change the lines between n = and K = .
Due esempi.
n = 3                 n = 7

A = 9                 A = 1148
B = 8                 B = 503
C = 6                 C = 721
D = 0                 D = 397
                      E = 865
                      F = 1321
                      G = 306
H = 0 |
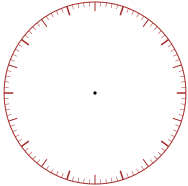
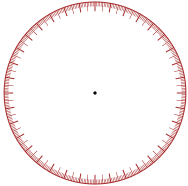
•• Un altro esempio di immagine animata, senza fine: un orologio contasecondi: anima. [se usi un Mac, non impiegare Safari ma un altro browser]
•• Another example of animated image: a second counter clock: anima. [if you employ a Mac, don't use Safari but another browser]
<title>clock</title>
<img src="http://macosa.dima.unige.it/point.gif" style="position:relative">
<img src="http://macosa.dima.unige.it/clock.png" style="position:static">

<table width=420><tr><td align=center><b>1 minute</b></td></tr></table>

<canvas width="400" height="400"></canvas>
<script>
fig = document.querySelector("img")
ang = -Math.PI/2
function anima(t, t0) {if(t0 != null) {ang = ang+(t-t0)/9549}
         fig.style.top  = (Math.sin(ang)*200-195)+"px"
         fig.style.left = (Math.cos(ang)*200+209)+"px"
         requestAnimationFrame( newTime => anima(newTime,t) )
         }
requestAnimationFrame(anima)
</script>
| |  |
•• Oltre ad animare le figure c'è la possibilità di
gestire gli eventi, ad esempio di proseguire l'esecuzione di uno script quando si preme un certo tasto. Un semplice esempio:
page. (altr esempi qui e qui)
•• In addition to animating the figures, there is the possibility to manage events, for example to continue the execution of a script when a certain key is pressed. A simple example:
page. (other examples here and here)
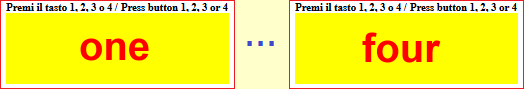
<table width=400><tr><td align=center><b>
Premi il tasto 1, 2, 3 o 4  /  Press button 1, 2, 3 or 4
</b></td></tr></table>
<canvas width="400" height="200"></canvas>
<script>
Width=400; Height=200                                // <-- change
minX=0; maxX=40; minY=0; maxY=20
Mx=Width/(maxX-minX)
My=Height/(maxY-minY)  // per un sistema monometrico prendi / for the same scale take  My=Mx
B=(0-minX)*Width/(maxX-minX); H=(maxY-0)*Height/(maxY-minY)
function X(a) {return B+a*Mx}; function Y(b) {return H-b*My}
let cx = document.querySelector("canvas").getContext("2d");
cx.beginPath(); cx.lineWidth=200; cx.strokeStyle="yellow"

cx.strokeRect( X(0), Y(20), 400, 200)
cx.fillStyle = "red"; cx.font = "bold 80px Arial"; cx.fillText("one", X(11), Y(8) )
window.addEventListener( "keydown", event => { if(event.key=="2") {
  cx.strokeRect( X(0), Y(20), 400, 200); cx.fillStyle = "red";
  cx.font = "bold 80px Arial"; cx.fillText("two", X(11), Y(8) )
  } } )
window.addEventListener( "keydown", event => { if(event.key=="3") {
  cx.strokeRect( X(0), Y(20), 400, 200); cx.fillStyle = "red";
  cx.font = "bold 80px Arial"; cx.fillText("three", X(10), Y(8) )
  } } )
window.addEventListener( "keydown", event => { if(event.key=="4") {
  cx.strokeRect( X(0), Y(20), 400, 200); cx.fillStyle = "red";
  cx.font = "bold 80px Arial"; cx.fillText("four", X(10), Y(8) )
  } } )
window.addEventListener( "keydown", event => { if(event.key=="1") {
  cx.strokeRect( X(0), Y(20), 400, 200); cx.fillStyle = "red";
  cx.font = "bold 80px Arial"; cx.fillText("one", X(11), Y(8) )
  } } )
cx.stroke()
</script>
Ecco altri grafici. Qualche esempio di quanto puoi trovare: / Here are other charts. Some examples of what you can find:
( # ) Se usi un Mac, ti conviene usare un qualunque browser (Edge, Firefox, Opera, …) diverso da Safari,
che non riconosce "with(Math)" in alcuni file in JavaScript (vedi). Comunque,
i file qui presenti sono stati modificati in modo da funzionare anche in Safari (se ci sono problemi scrivete).
/
If you use a Mac, you should use any browser (Edge, Firefox, Opera, ...) other than Safari,
which doesn't recognize "with(Math)" in some JavaScript files (see).
However, the files here have been modified to work in Safari too (if there are any problems write).
altro su javascript