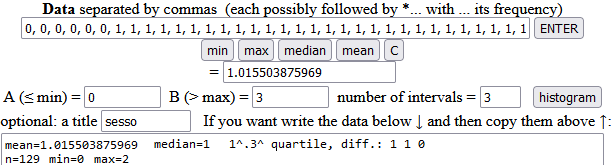
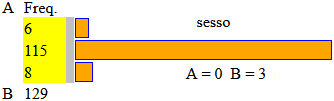
This file collects some data (peso/weight, lunghezza/length, lunghezza senza la coda/length without tail, sesso/sex, peso delle gonadi/weight of the gonads) relating to 129 two-year-old farmed trout (trote) collected by some university students. We analyze the data. Taking a look at the data we immediately see that the trout are almost all female. We make the histogram of the "sesso/sex" data (0 unidentified, 1 F, 2 M) using this file (I copy the sex data - 0,0, ..., 2 - and insert them into it).
I get:
At this point, among the data collected, we examine only those of female trout. Let's do the boxplots, using this script.
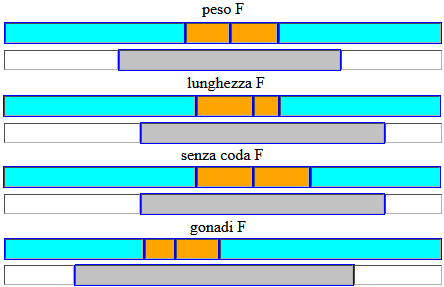
peso F
mean=192.843
min=111.9 1^ quartile=176 median=191.4 3^ quartile=208.5 max=266.4
41.5% 10% 11.1% 37.5%
← 5^ percentile=152 95^ percentile=230.5 →
lunghezza F
mean=26.352
min=22 1^ quartile=25.5 median=26.5 3^ quartile=27 max=30
43.8% 12.5% 6.3% 37.5%
← 5^ percentile=24.5 95^ percentile=29 →
senza coda F
mean=23.057
min=18.5 1^ quartile=22 median=23 3^ quartile=24 max=26.5
43.8% 12.5% 12.5% 31.3%
← 5^ percentile=21 95^ percentile=25.5 →
gonadi F
mean=0.255
min=0.055 1^ quartile=0.206 median=0.239 3^ quartile=0.285 max=0.529
31.9% 7% 9.7% 51.5%
← 5^ percentile=0.129 95^ percentile=0.432 →
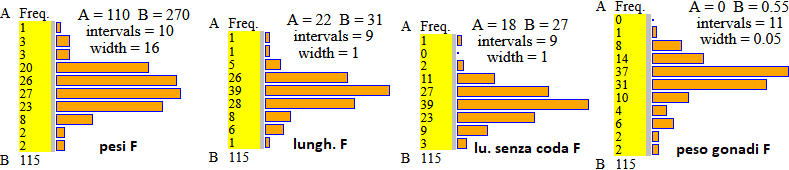
I can observe, incidentally, that the weight of the gonads of males is significantly lower (0.010, 0.020, 0.026, 0.068, 0.075, 0.105, 0.111, 0.121 against the average 0.255). The trends of the box-plots are confirmed by those of the histograms, which were created with this script.
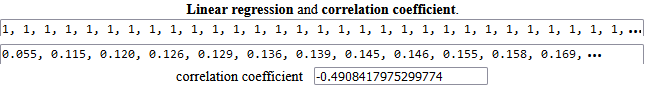
As already noted, the (negative) correlation between sex (1 F, 2 M) and weight of the gonads is evident. We use this script:
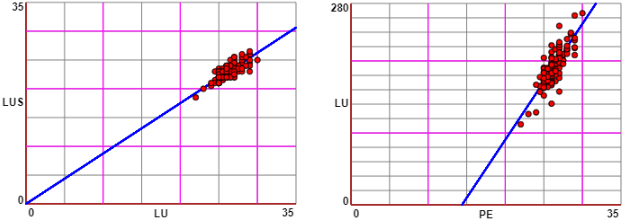
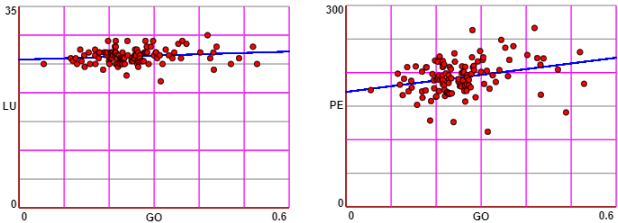
We expect greater correlations between "length" and "tailless length", between length and weight. We then explore the one between weight of the gonads and both length and weight. We limit ourselves to females.
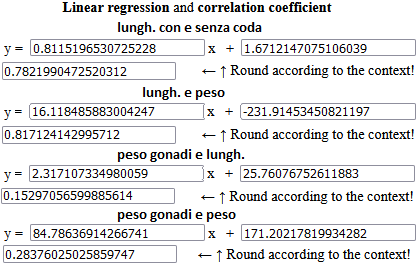
In the case of lengths with and without tail, perhaps it would be better to impose the passage for (0,0): assuming a trout of length 0, if I cut the tail the length remains 0 (the correlation coefficient obviously does not change).
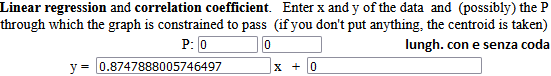
If we represented the data we would expect in the first two cases their distribution, fairly aligned, along the two regression lines. In the latter two cases we would expect less alignment. If desired, we can graphically represent data and regression lines with scripts of this kind.