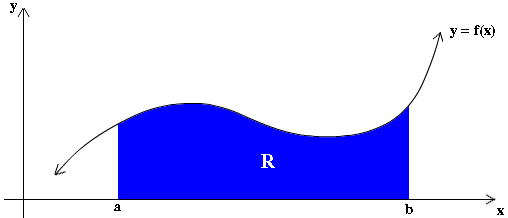
Riemann Sums
Suppose that a function f is continuous and non-negative on an
interval [a,b].
Let's compute the area of the region R bounded above by the curve
y = f(x), below by the x-axis, and on the sides by the lines x = a and
x = b.
We will obtain this area as the limit of a sum of areas of rectangles
as follows:
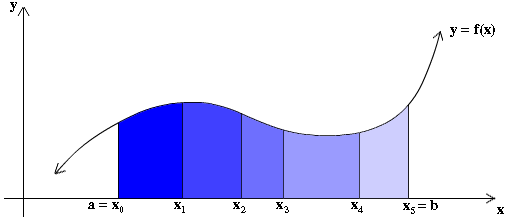
First, we will divide the interval [a,b] into n subintervals
| [x0, x1],
[x1, x2], …,
[xn-1, xn] |
where a = x0 <
x1 <
… <
xn = b. (This is called a
partition of the interval.) The intervals need not
all be the same length, so call the lengths of the intervals
Δx1,
Δx2, ...,
Δxn, respectively. This
partition divides the region R into n strips.
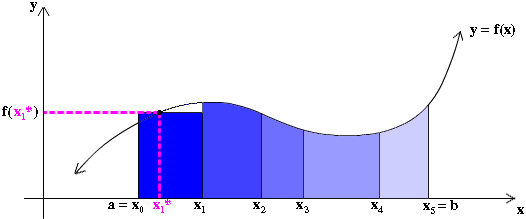
Next, let's approximate each strip by a rectangle with height equal to
the height of the curve y = f(x) at some arbitrary point in the
subinterval. That is, for the first subinterval [x0,
x1], select some
x1* contained in that
subinterval and use f(x1*) as
the height of the first rectangle. The area of that rectangle is then
f(x1*)
Δx1.
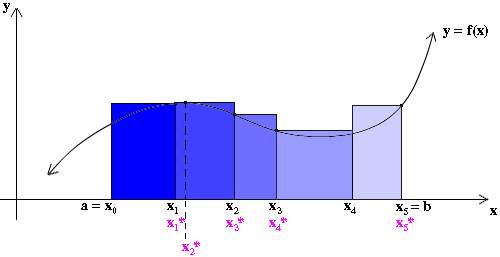
Similarly, for each subinterval [xi-1, xi],
we will choose some xi*
and calculate the area of the corresponding rectangle to be
f(xi*)
Δxi.
The approximate area of the region R is then the sum
Σin=
1 f(xi*)
Δxi of these rectangles.

Depending on what points we select for the
xi*, our estimate
may be too large or too small. For example, if we choose each
xi* to be the point
in its subinterval giving the maximum height, we will
overestimate the area of R. (This is called an upper
sum.)
If, on the other hand, we choose each
xi* to be the point
in its subinterval giving the mimimum height, we will
underestimate the area of R. (This is called a
lower sum.)
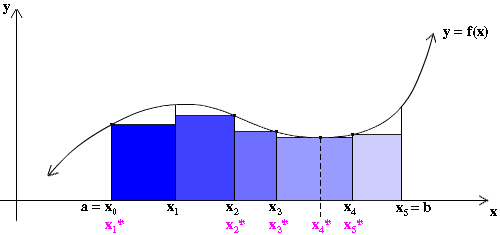
When the points xi*
are chosen randomly, the sum
Σin= 1
f(xi*)
Δxi is called a Riemann
Sum
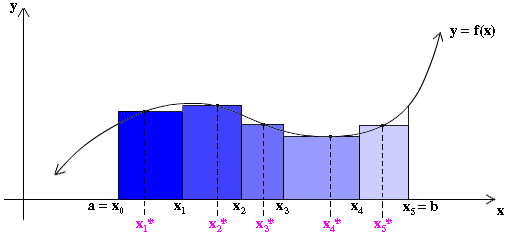
and will give an approximation for the area of R that is in between
the lower and upper sums. The upper and lower sums may be considered
specific Riemann sums.
As we decrease the widths of the rectangles, we expect to be able to
approximate the area of R better. In fact, as max
Δxi → 0,
we get the exact area of R, which we denote by the definite integral
That is,
| ∫ |
b
a
|
f(x) dx = lim max
Δxi→ 0 |


 |
n
Σ
i = 1
|
f(xi*)Δxi |

 |
[note: n → ∞ as max Δxi → 0]
• lim max Δxi → 0 Σi=0..n f(xi*)Δxi = L
significa che:
per ogni ε > 0 esiste δ tale che comunque prenda una partizione
xi con (ossia: comunque prenda n e una partizione x1,...,xn di [a,b] tali che) max Δxi < δ e
comunque scelga xi* in [xi-1, xi],
Σif(xi*)Δxi
dista da L meno di ε.
|
• Se, come qui, si definisce F continua in un intervallo se è continua
in tutti i suoi punti, per dimostrare che ogni funzione continua in un intervallo [a,b]
è ivi integrabile (ossia che il limite di cui sopra esiste ed è finito, ovvero che
all'infittire della partizione le somme di Riemann tendono a stabilizzarsi tutte sullo stesso numero)
occorrerebbe dimostrare la proprietà, fondamentale, che se una funzione è
continua in un intervallo [a,b] allora si ha che in esso gli output infittiscono
all'infittirsi degli input, ossia che comunque fissi ε posso
trovare Δx tale, in ogni intervallo di ampiezza Δx contenuto in [a,b], F
abbia una variazione Δy minore di ε.
Da questa proprietà posso infatti dedurre che al tendere a zero di
max Δxi tende a zero la differenza tra "lower sum" e
"upper sum" e che quindi esiste finito
limmax Δxi→0Σif(xi*)Δxi.
La dimostrazione che il limite esiste vale per ogni funzione continua, non solo per quelle a valori positivi. Nel caso la funzione f sia a valori negativi i "rettangolini" sono sotto all'asse x e il valore che si ottiene è negativo, opposto al valore che si otterrebbe per la funzione -f. In altre parole si tratta dell'area tra grafico di f e asse x presa con segno negativo.
La proprietà sopra richiamata, nota come "uniforme continuità",
corrisponde all'idea che, nel tracciare il grafico di F, infittendo la tabulazione delle x,
si ottiene un insieme di punti le cui ordinate sono sempre più fitte,
e quindi sono anch'essi sempre più fitti. Sullo schermo di un computer si ha che,
per quanto si faccia uno zoom sull'intervallo, prima o poi,
aumentando il numero di numero degli intervallini della partizione
(e tracciando il grafico a "punti non congiunti"), si arriva comunque a un insieme connesso
(senza salti) di pixel. | | Una funzione continua in un dato intervallo e una che non lo è: |
  |
Notes
Si può dimostrare che una funzione definita in [a,b] e ivi limitata è integrabile in [a,b]
(ossia per essa il limite di cui sopra esiste ed è finito)
anche nel caso in cui f abbia solo un numero finito (o una inifinità numerabile) di punti di discontinuità e in quello in cui sia monotona.
Se I = [a, b], l'integrale tra a e b di f può essere indicato anche con ∫I f. Se a > b si può considerare come integrale di f tra a e b il numero –∫[b,a] f.
Se I = [a, b] e J = [b, c], allora ∫ I U J f
= ∫ I f + ∫ J f
[additivity with respect to the interval of integration]
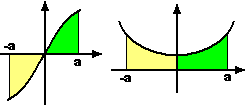
Se f è dispari, ossia ha grafico simmetrico rispetto a (0,0),
si ha che ∫[0,x]f = ∫[0,-x]f = -∫[x,0]f
Con ragionamento simile si ha che, invece, se f è pari, ossia ha grafico simmetrico
rispetto all'asse y, ∫[0,x]f = -∫[0,-x]f = ∫[x,0]f
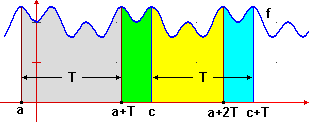
Se f è periodica di periodo T si ha che gli integrali di f su intervalli di ampiezza T
sono tutti uguali.
For a more rigorous treatment of Riemann sums, consult your
calculus text.
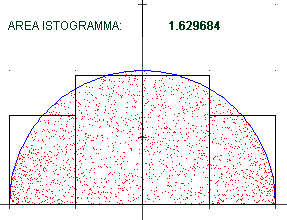 |
Somme di Riemann con
partizione in intervallini uguali e
scelta degli xi* al centro degli intervallini.
1.629684
1.591965 (diff.=0.037719)
1.578343 (diff.=0.013622)
1.573476 (diff.=0.004867)
1.571746 (diff.=0.001730)
... | |
∫[-1,1] √(1 - x2) dx = π/2 = 1.570796326… |
Key Concept [index]
Let f be defined on [a, b] and let x0, x1,
…, xn be a partition of [a. b].
For each [xi-1, xi], let xi* ∈ [xi-1, xi].
Then the definite integral of f over [a, b] as defined as
| ∫ |
b
a
|
f(x) dx = limmax Δxi→ 0 |
|
n
Σ
i = 1
|
f(xi*)Δxi |
|
|