3^2+1^2 = 10
x^2+y^2 > 4 & (x-1)^2+(y-3)^2 < 10
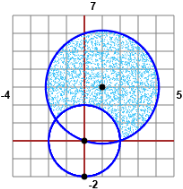
| Scrivi un sistema di disequazioni che descriva la figura tracciata a fianco (la parte che è interna ad un cerchio ed esterna ad un altro). | |
3^2+1^2 = 10 x^2+y^2 > 4 & (x-1)^2+(y-3)^2 < 10 |
I grafici con questo script.
O col software online WolframAlpha:
plot x^2+y^2=4 and (x-1)^2+(y-3)^2=3^2 and (x-1)^2+(y-3)^2<3^2 and x^2+y^2>4, -5 < x < 5, -3 < y < 7

# Come tracciare la figura con R (vedi):

PLANE(-3,5,-2,6)
circle(0,0, 2, "brown")
circle(1,3, sqrt(3^2+1^2), "brown")
P = function(x,y) x^2+y^2 > 4 & (x-1)^2+(y-3)^2 < 10
diseq2(P,0, "red")
POINT(1,3,"seagreen"); POINT(0,0,"seagreen"); POINT(0,-2,"seagreen")