P <- 2*pi
plot(c(-100,100),c(-100,100),type="n",xlab="",ylab="",axes=FALSE,asp=1)
symbols(0,0,circles=100, inches=FALSE, add=TRUE,lwd=2)
n <- 10; j <- 1:n; segments(sin(P/n*j)*100,cos(P/n*j)*100,0,0,col="grey",lty=2)
n <- 10; j <- 1:n; segments(sin(P/n*j+P/20)*100,cos(P/n*j+P/20)*100,0,0,col="grey",lty=3)
n <- 100; j <- 1:n; segments(sin(P/n*j)*100,cos(P/n*j)*100,sin(P/n*j)*90,cos(P/n*j)*90,col="brown")
points(0,0,col="brown")
# È il primo:
 dev.new(); P <- 2*pi
plot(c(-100,100),c(-100,100),type="n",xlab="",ylab="",axes=FALSE,asp=1)
n <- 100; j <- 1:n; segments(sin(P/n*j)*100,cos(P/n*j)*100,sin(P/n*j)*90,cos(P/n*j)*90,col="brown")
n <- 10; j <- 1:n; segments(sin(P/n*j)*100,cos(P/n*j)*100,sin(P/n*j)*85,cos(P/n*j)*85,col="brown",lwd=3)
n <- 10; j <- 1:n; segments(sin(P/n*j+P/20)*100,cos(P/n*j+P/20)*100,sin(P/n*j+P/20)*90,cos(P/n*j+P/20)*90,col="brown",lwd=3)
symbols(0,0,circles=100, inches=FALSE, add=TRUE,lwd=3,fg="brown")
points(0,0,col="brown",pch=20)
# È il secondo.
dati <- c(25,75,50); colori <- c("yellow","cyan","green")
R <- 0.9; R1 <- R*0.9; R2 <- R*0.8; P <- 2*pi; P0 <- P/20
pie(dati,radius=R,labels="",col=colori)
n <- 100; j <- 1:n; segments(sin(P/n*j)*R,cos(P/n*j)*R,sin(P/n*j)*R1,cos(P/n*j)*R1,col="brown")
n <- 10; j <- 1:n; segments(sin(P/n*j)*R,cos(P/n*j)*R,sin(P/n*j)*R1,cos(P/n*j)*R1,col="brown",lwd=3)
n <- 10; j <- 1:n; segments(sin(P/n*j+P0)*R,cos(P/n*j+P0)*R,sin(P/n*j+P0)*R2,cos(P/n*j+P0)*R2,col="brown",lwd=3)
symbols(0,0,circles=R, inches=FALSE, add=TRUE,lwd=3,fg="black")
points(0,0,col="brown",pch=20)
# È il terzo.
#
# Alternative (1°):
source("http://macosa.dima.unige.it/r.R")
box0(-1,1, -1,1); cerchio(0,0, 1, 4)
R1 <- 0.95; R2 <- R1*0.95; R3 <- R2*0.95
for(i in 0:360) {a <- 360/360*i; linea(xrot(a)*R1,yrot(a)*R1,xrot(a),yrot(a),4)}
for(i in 0:36) {a <- 360/36*i; linea(xrot(a)*R3,yrot(a)*R3,xrot(a),yrot(a),4)}
for(i in 0:36) {a <- 360/36*(i+1/2); linea(xrot(a)*R2,yrot(a)*R2,xrot(a),yrot(a),4)}
puntino(0,0,4)
#
# Alternative (2° e 3°):
box0(-1,1, -1,1); cerchio(0,0, 1, 4)
R1 <- 0.9; R2 <- R1*0.9
for(i in 0:100) {a <- 360/100*i; linea(xrot(a)*R1,yrot(a)*R1,xrot(a),yrot(a),4)}
for(i in 0:10) {a <- 360/10*i; segm(xrot(a)*R1,yrot(a)*R1,xrot(a),yrot(a),4)}
for(i in 0:10) {a <- 360/10*(i+1/2); segm(xrot(a)*R2,yrot(a)*R2,xrot(a),yrot(a),4)}
puntino(0,0,4)
#
dati <- c(25,75,50); colori <- c("yellow","cyan","green")
box0(-1,1, -1,1); R1 <- 0.9; R2 <- R1*0.9
pie(dati,radius=1,labels="",col=colori)
for(i in 0:100) {a <- 360/100*i; linea(xrot(a)*R1,yrot(a)*R1,xrot(a),yrot(a),"brown")}
for(i in 0:10) {a <- 360/10*i; segm(xrot(a)*R1,yrot(a)*R1,xrot(a),yrot(a),"brown")}
for(i in 0:10) {a <- 360/10*(i+1/2); segm(xrot(a)*R2,yrot(a)*R2,xrot(a),yrot(a),"brown")}
cerchio(0,0, 1, "brown")
#
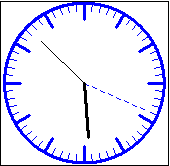
orologio2(17,52,19)
dev.new(); P <- 2*pi
plot(c(-100,100),c(-100,100),type="n",xlab="",ylab="",axes=FALSE,asp=1)
n <- 100; j <- 1:n; segments(sin(P/n*j)*100,cos(P/n*j)*100,sin(P/n*j)*90,cos(P/n*j)*90,col="brown")
n <- 10; j <- 1:n; segments(sin(P/n*j)*100,cos(P/n*j)*100,sin(P/n*j)*85,cos(P/n*j)*85,col="brown",lwd=3)
n <- 10; j <- 1:n; segments(sin(P/n*j+P/20)*100,cos(P/n*j+P/20)*100,sin(P/n*j+P/20)*90,cos(P/n*j+P/20)*90,col="brown",lwd=3)
symbols(0,0,circles=100, inches=FALSE, add=TRUE,lwd=3,fg="brown")
points(0,0,col="brown",pch=20)
# È il secondo.
dati <- c(25,75,50); colori <- c("yellow","cyan","green")
R <- 0.9; R1 <- R*0.9; R2 <- R*0.8; P <- 2*pi; P0 <- P/20
pie(dati,radius=R,labels="",col=colori)
n <- 100; j <- 1:n; segments(sin(P/n*j)*R,cos(P/n*j)*R,sin(P/n*j)*R1,cos(P/n*j)*R1,col="brown")
n <- 10; j <- 1:n; segments(sin(P/n*j)*R,cos(P/n*j)*R,sin(P/n*j)*R1,cos(P/n*j)*R1,col="brown",lwd=3)
n <- 10; j <- 1:n; segments(sin(P/n*j+P0)*R,cos(P/n*j+P0)*R,sin(P/n*j+P0)*R2,cos(P/n*j+P0)*R2,col="brown",lwd=3)
symbols(0,0,circles=R, inches=FALSE, add=TRUE,lwd=3,fg="black")
points(0,0,col="brown",pch=20)
# È il terzo.
#
# Alternative (1°):
source("http://macosa.dima.unige.it/r.R")
box0(-1,1, -1,1); cerchio(0,0, 1, 4)
R1 <- 0.95; R2 <- R1*0.95; R3 <- R2*0.95
for(i in 0:360) {a <- 360/360*i; linea(xrot(a)*R1,yrot(a)*R1,xrot(a),yrot(a),4)}
for(i in 0:36) {a <- 360/36*i; linea(xrot(a)*R3,yrot(a)*R3,xrot(a),yrot(a),4)}
for(i in 0:36) {a <- 360/36*(i+1/2); linea(xrot(a)*R2,yrot(a)*R2,xrot(a),yrot(a),4)}
puntino(0,0,4)
#
# Alternative (2° e 3°):
box0(-1,1, -1,1); cerchio(0,0, 1, 4)
R1 <- 0.9; R2 <- R1*0.9
for(i in 0:100) {a <- 360/100*i; linea(xrot(a)*R1,yrot(a)*R1,xrot(a),yrot(a),4)}
for(i in 0:10) {a <- 360/10*i; segm(xrot(a)*R1,yrot(a)*R1,xrot(a),yrot(a),4)}
for(i in 0:10) {a <- 360/10*(i+1/2); segm(xrot(a)*R2,yrot(a)*R2,xrot(a),yrot(a),4)}
puntino(0,0,4)
#
dati <- c(25,75,50); colori <- c("yellow","cyan","green")
box0(-1,1, -1,1); R1 <- 0.9; R2 <- R1*0.9
pie(dati,radius=1,labels="",col=colori)
for(i in 0:100) {a <- 360/100*i; linea(xrot(a)*R1,yrot(a)*R1,xrot(a),yrot(a),"brown")}
for(i in 0:10) {a <- 360/10*i; segm(xrot(a)*R1,yrot(a)*R1,xrot(a),yrot(a),"brown")}
for(i in 0:10) {a <- 360/10*(i+1/2); segm(xrot(a)*R2,yrot(a)*R2,xrot(a),yrot(a),"brown")}
cerchio(0,0, 1, "brown")
#
orologio2(17,52,19)
 orologio()