
Examples (Per la scuola di base / Basic school)
Attenzione: 1/2; 5/4; ... → 0.5; 1.25; ... non 0,5; 1,25; ...
 |  |
| 10 + 5 + 7 | |
 |
 |
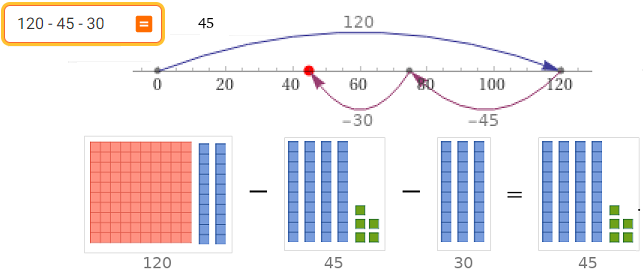
120 - 45 - 30 see also/vedi anche see also/vedi anche
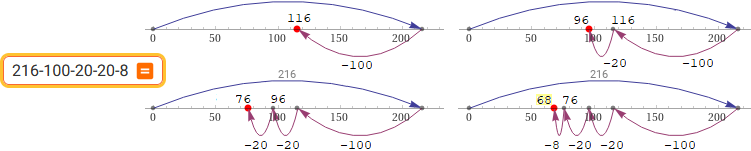
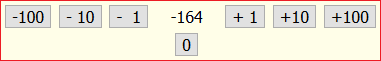
216-100-20-20-8
7 - 5 + 3 - 5 + 8 -7 + 2 - 8 + 10 5
 |
 |  | 7*5 35/5 |

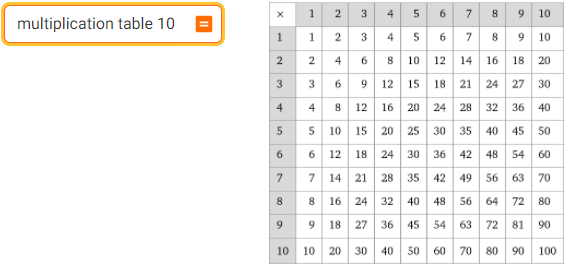
multiplication table 10

7*N for N = 0, 1, 2, 3,..., 11 "for" = "per"

line(-12, -9, -6, -3, 0, 3, 6, 9, 12, 15, 18, 21, 24)
line(7,8,9,10,11,12) line(7,12) line(0, 2.7)
 |
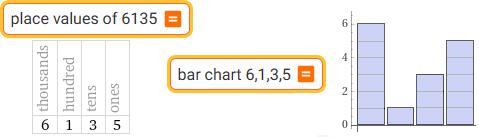 | place values of 6135 | bar chart 6,1,3,5 |
 |
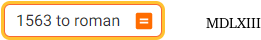
1563 to roman
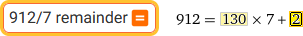 | 912/7 remainder |

from 0 to 90 by 7
 | {7, 9, 15, 16, 17, 21, 23} | sort (7, 23, 15, 21, 17, 16, 9) |
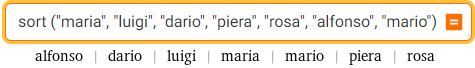
sort("maria","luigi","dario","piera","rosa","alfonso","mario")
 | hand written style ... scrittura "a mano" |

12345 12 mila 345 123456789 123 milioni 456 mila 789
lapis | pen
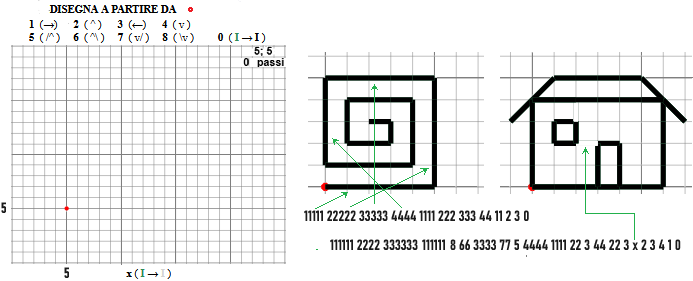
avvio all'uso delle coordinate | starting to use coordinates
Con WolframAlpha non è possibile tracciare facilmente linee spezzate come quelle fatte con lapis.
With WolframAlpha it is not possible to easily draw chains of segmentes like the ones made with pen.
plot {(5,5);(10,5);(10,10);(5,10);(5,6);(9,6);(9,9);(6,9);(6,7);(8,7);(8,8);(7,8) }
i punti sono collegati ma passi orizzontali e verticali sono diversi / the points are connected but horizontal and vertical steps are different
plot {(5,5);(10,5);(10,10);(5,10);(5,6);(9,6);(9,9);(6,9);(6,7);(8,7);(8,8);(7,8)} color red
i punti sono colorati / the dots are colored
(5,5);(10,5);(10,10);(5,10);(5,6);(9,6);(9,9);(6,9);(6,7);(8,7);(8,8);(7,8)
passi orizzontali e verticali sono uguali ma i punti non sono collegati / horizontal and vertical steps are the same but the points are not connected
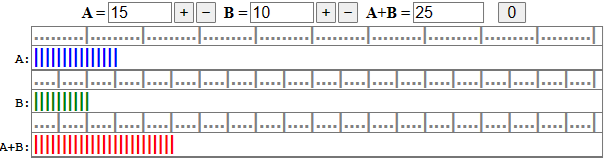
first equations (A)
first equations (B)
first equations (C) first equations (D)
prime equazioni (A) prime equazioni (B)
prime equazioni (C) prime equazioni (D)
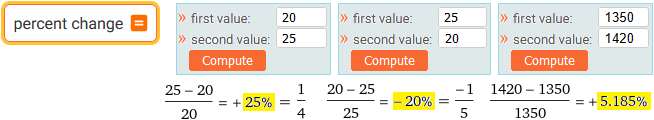
percent change varizione percentuale


0.333... 1.333... 2.333... 0.474747... 2.474747...

8/(6-2)*(5/3)/2-(3/2/(2*5)+1) | 8/(6-2)*(5/3)/2-(3+2/(2*5)+1)

 |
simplify fractions

piccola calcolatrice / little pocket calculator

1/6 + 5/12 + 3/4

102/360 123456/123
 | solve ... for x |

Le equazioni dalla forma a/b = c/d (il rapporto tra a e b è uguale a quello tra c e d) sono chiamate anche proporzioni
Equations of the form a/b = c/d (the ratio between a and b is the same as that between c and d) are also called proportions

solve 3x+1 = x-2 for x solve 3x+1 = (2+6x)/2 for x solve 3x+1 = (6x+1)/2 for x
floor(123456.4567, 100) ... round(123456.4567, 100) ...
troncamento e arrotondamento truncation and rounding
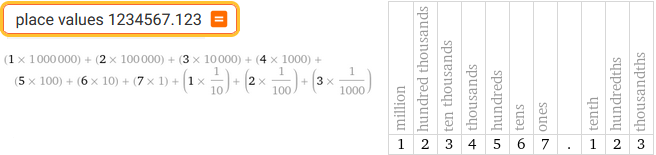
value of 7 in 35.875 | place values 1234567.123
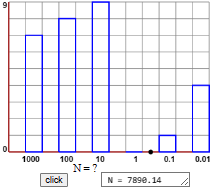 |
10^N for N = -5, -4, -3, ..., 5
7 * 10^N for N = -5, 0, 5
|
division divisione | 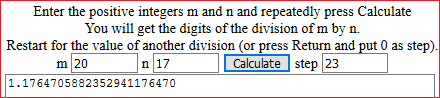 |
|
somma / moltiplica / media sum / product / mean | 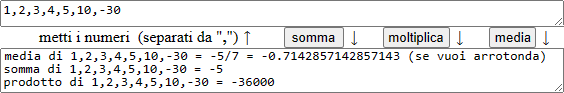 |
midpoint punto medio
area square side 5
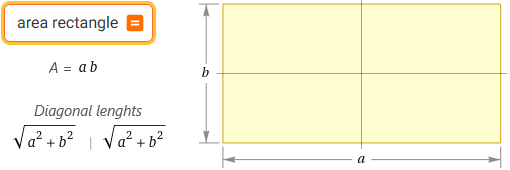
area rectangle 21 cm, 32 cm ... area rectangle
triangle area calculator
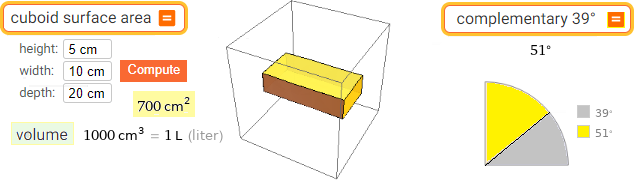
cuboid surface area | complementary 39° (rectangular cuboid = parallelepipedo rettangolo)
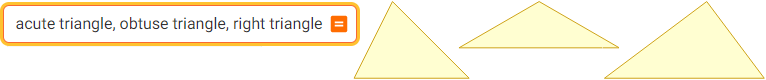
acute triangle, obtuse triangle, right triangle
 | diamond area area del rombo |
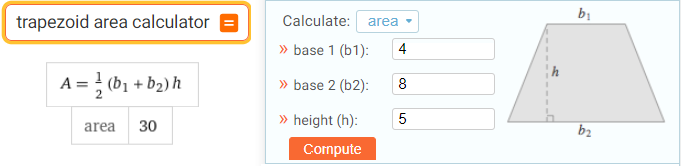
trapezoid area calculator
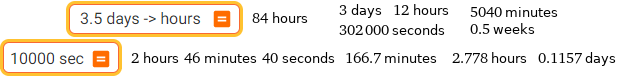
3.5 days -> hours | 10000 sec

minimal coin form 26.85 euros

1 euro | image euro

19:32:55

this month | now
temperature ...

interval (0, 4), (2, 6], [4, 11]
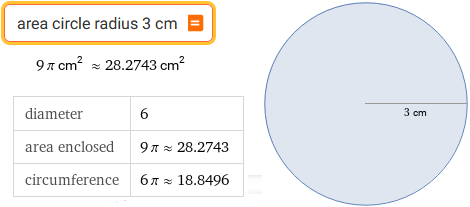
area circle radius 3 cm
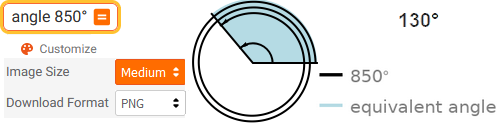
angle 850 °
polygon ...
 | pie chart {60, 10, 30, 50} diagramma a torta |
 |
 | 3/8 -> % |  | tape diagram 3/8 diagramma a nastro |
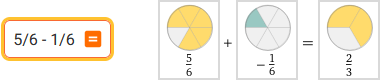 | 5/6 -1/6 |


7/8 | mixed fraction 12.6 | 66.66...%
 | 0.2999... |
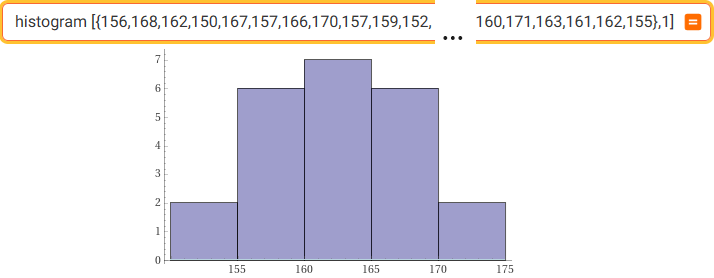
156, 168, 162, 150, 167, 157, 166, 170, 157, 159, 152, 164, 157, 165, 163, 169, 165, 160, 171, 163, 161, 162, 155
histogram [{156, ..., 155}, 1] [per più dati vedi sotto / for more data see below]
sort{156, ..., 155} median{156, ..., 155} mean{156, ..., 155} ordina, mediana, media
 | se usi / if you use histogram {156, ..., 155} |

scientific notation of ...
| scientific notation / notazione scientifica | 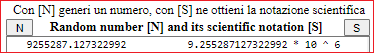 |
factor ... fattorizza
 | divisors 24, 20, 12 gcd 24, 20, 12 |

multiples ... lcm ... multipli, minimo comune multiplo


simplify ... expand ... semplifica, sviluppa


equation solver
"> 0" → "sgn = 1" come esprimere le soluzioni di / how to express the solutions of 5x²+2x-8 > 0
 |
Se nelle soluzioni prodotte compare i queste soluzioni non sono da accettare. L'equazione a fianco non ha soluzioni. If i appears in the solutions produced, these solutions are not to be accepted. Equation a on the left has no solutions |

complete the square 6x^2+10x+28
solve system of 2 equations 1, 0, infinite solutions
 |

3*x^2 - x/2 + 5 if x = -3, -2, -1, 0, 5 plot y = 3*x^2 - x/2 + 5, -4 < x < 6
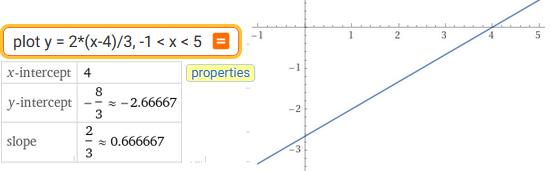
plot y = 2*(x-4)/3, -1 < x < 5
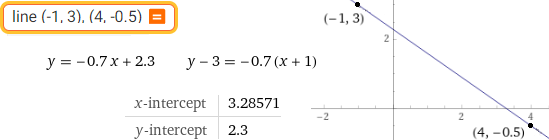
line (-1, 3), (4, -0.5)

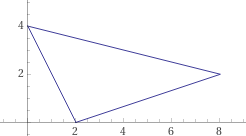
line segment (0,4), (2,0), line segment (2,0),(8,2), line segment (8,2),(0,4)
Posso disegnare solo 3 figure con comandi espliciti / I can only draw 3 figures with explicit commands
plot y = -x, y = x, y=2x, y=x/2, -3 < x < 3, -2 < y < 2 | plot y = 1.5x, y = 1.5x +1, y=1.5x-1, -3 < x < 3, -2 < y < 2
plot y = 1/2*x^2-x+1, y = x^2-x+1, y = 2x^2-x+1, -2 < x < 4, 0 < y < 4
or: plot y = a*x^2-x+1 for a = 1/2, 1, 2, -2 < x < 4, 0 < y < 4
- - - - - - - - - - - - - - - - - - - - - - - - - -
With "points" and "segment line" a monometric scale is used. Even in the previous graphs the scale is monometric:
when you graph a function, to have a monometric scale take: width = 3/2*height
(or width = 1.5*height or: height = width/1.5 or: height = width*2/3)
Con "points" e "segment line" viene usata una scala monometrica. Anche nei grafici precedenti la scala è monometrica:
tracciando il grafico di una funzione per avere una scala monometrica prendi: larghezza = 3/2*altezza
(o larghezza = 1.5*altezza o: altezza = larghezza/1.5 o: altezza = larghezza*2/3)
- - - - - - - - - - - - - - - - - - - - - - - - - -
| I grafici animati con desmos |  |


 | pendenza |  |

| pendenza slope | 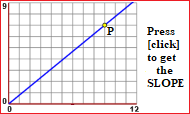 |
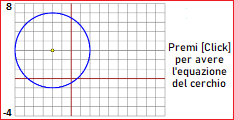
cerchio circle |
 |
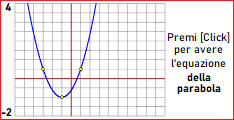
parabola parable |
 |
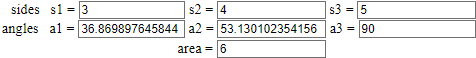
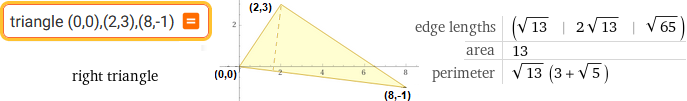
| angles/sides/area of a triangle angoli/lati/area di un triangolo |
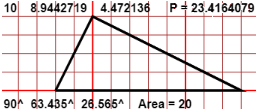 |
triangle (if I know 3 Sides/Angles, se conosco 3 lati/angoli)
triangle ... side ... angle ...
A long road is inclined at (6.5±0.25)°. If I walk 240 m how much will I rise?
Una lunga strada è inclinata di (6.5±0.25)°. Se cammino per 240 m di quanto mi innalzo?
27.2 ± 1.1 m (≈ 27 ± 1 m)
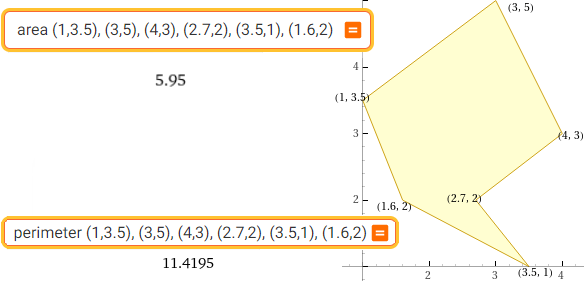
area (1,3.5), (3,5), (4,3), (2.7,2), (3.5,1), (1.6,2) | perimeter (1,3.5), (3,5), (4,3), (2.7,2), (3.5,1), (1.6,2)
| triangoli triangles | 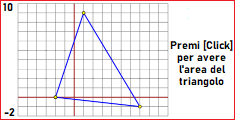 | quadrangoli quadrangles | 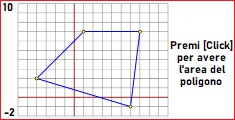 |
triangle (0,0), (10, 0), (7,9), line segment (4,0),(7,9), line segment (8,6), (6*7/9, 6)
circle center (2,3) radius 2; circle center (2,3) radius 1 | circle (2.5, 3), (4, 0), (5.5, 1)
dist (-1,2), (3,6) | dist (0,0,0), (2,2,2) | dist (1, 0.5), y=3x+4 | dist (1,-2), line (-2,0),(1,6)
perpendicular bisector line segment endpoints (1,3), (-2,-3) asse di un segmento
heights triangle (-2,4),(2.5,3),(3,0.4) altezze di un triangolo
angle between (0.6, -1.5) and (2, 1.5)
| angle ABC / angolo ABC |  |
angle between (4--2, -1-1) and (3--3, 2-1)
 angle bisector bisettrice
 |
i nomi dei punti sul cerchio unitario the names of the points on the unit circle |
| circle center(0,0) radius 1, line segment(0,0),(cos 30°,sin 30°), segment(0,0),(cos 120°,sin 120°) |
 |
 | line segment(0,0),(cos 20°,sin 20°), segment(0,0),(cos 80°,sin 80°), segment(0,0),(cos((20+80)/2°),sin((20+80)/2°)) la bisettrice dell'angolo con i lati nelle direzioni di 20° e 80° the bisector of the angle with the sides in the directions of 20° and 80° |

subsets of {a,b,c}

U | intersection | \
A U B | A intersect B | A \ B
relative difference
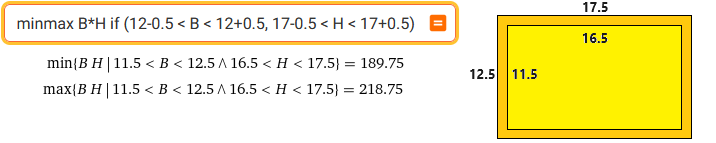
minmax B*H if (17-0.5 < B < 17+0.5, 12-0.5 < H < 12+0.5)
B = 17±0.5 cm, H = 12±0.5 cm → 189.75 cm² ≤ Area ≤ 218.75 cm²
Due località distano 33±1 km. Luigi ha impiegato, in auto, 23±1 min per percorrerla. Qual è la velocità media con cui ha viaggiato.
Two locations are 33±1 km apart. It took Luigi, by car, 23±1 min to travel it. What is the average speed at which he travelled.

minmax x/y if 33-1 < x < 33+1, 23/60-1/60 < y < 23/60+1/60
space = 33±1 km, time = 23/60±1/60 h → 80 km/h ≤ v ≤ 88.7 km/h
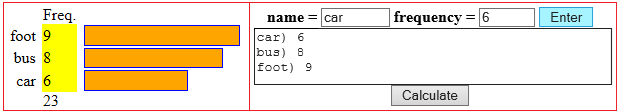
Gli istogrammi realizzati come visto sopra sono fattibili solo con pochi dati. Una alternativa (anche per migliaia di dati) è il seguente programma, che usiamo prima per gli stessi dati, poi per una quantità maggiore.
The histograms created as seen above are only feasible with a little data. An alternative (even for thousands of data) is the following program, which we use first for the same data, then for a larger quantity.
Incollo nel box i dati considerati sopra, premo "clicca" e poi "minimo", "massimo" (e se voglio "media" e "mediana"), metto "A", "B" e "numero intervalli" (e se voglio un "titolo") e premo "istogramma"
I paste the data considered above into the box, press "click" and then "minimum", "maximum" (and if I want "mean" and "median"), I put "A", "B" and "number of intervals" (and if I want a "title") and press "histogram"
Ecco l'istogramma dei pesi di 4170 giovani maschi ventenni italiani nel 1990
The body weight of 4170 Italian males in their twenties, in the year 1990
I dati / the data
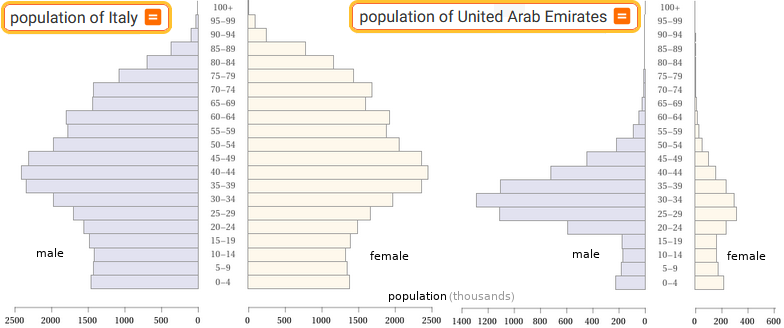
population of Italy | population of United Arab Emirates
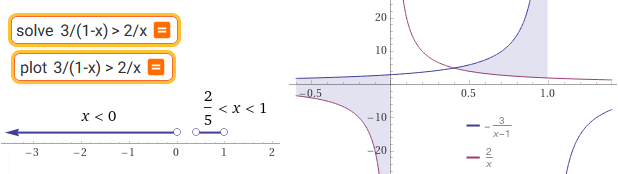
solve 3/(1-x) > 2/x | plot 3/(1-x) > 2/x

x^2 >= 9 and 0 <= x < 5 and 64 > x^3 > 8
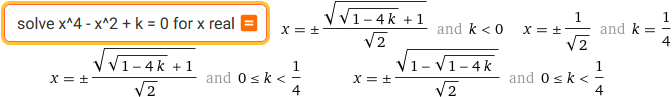
solve x^4 - x^2 + k = 0 for x real
"for x real" serve per escludere i casi in cui ho √ di numero < 0 / to exclude cases where I have √ of number < 0
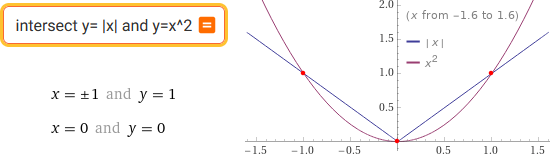
intersect y = |x| and y = x^2
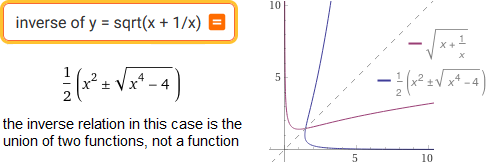
inverse of y = sqrt(x + 1/x)
rotation transform calculator
rotate (1,1) around (0,0) 45° clockwise | rotate (4,2) around (2,1) 60°
vector (-9, 12.8) The normalized vector, or unit vector ("versore" in italiano), has the same direction but length 1
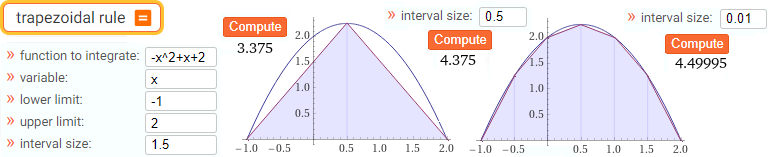
trapezoidal rule
integrate -x^2+x+2 from -1 to 2
d/dx 3x^2-5x+1
lim (x^2+x-2)/(x-1) as x -> 1
Per esempi più avanzati / For more advanced examples see here / vedi qui