# Two processes that generate a point falling into the circle with center O and
# radius 1 and test if its distance from O is less than 1/2.
BF=3;HF=3; BOXW(-1,1, -1,1)
circle(0,0, 1, "brown"); circle(0,0, 1/2, "brown"); BOX()
type(-1,1,"-1"); type(1,1,"1"); type(-1,-1,"-1"); type(1,-1,"1")
n = 0; ok = 0; M = 10000
for (i in 1:M) {x <- runif(1, -1,1); y <- runif(1, -1,1); d <- x*x+y*y
if(d < 1){n <- n+1; Dot(x,y,"brown"); if(d < 0.25) ok <- ok+1}}
cat("n.throws ",n," %OK ",ok/n*100,"\n")
#
BF=3;HF=3; BOXW(-1,1, -1,1)
type(-1,1,"-1"); type(1,1,"1"); type(-1,-1,"-1"); type(1,-1,"1")
circle(0,0, 1, "brown"); circle(0,0, 1/2, "brown"); BOX()
ok = 0; n = 10000
for(i in 1:n) {r <- runif(1); a <- runif(1, 0,pi*2); x <- r*cos(a); y <- r*sin(a)
d <- x*x+y*y; Dot(x,y,"brown"); if(d < 0.25) ok <- ok+1}
cat("n.throws ",n," %OK ",ok/n*100,"\n")
 n.throws 7851 %OK 25.11782 (-> 1/4) n.throws 10000 %OK 49.7 (-> 1/2)
# The three-dimensional representation:
n.throws 7851 %OK 25.11782 (-> 1/4) n.throws 10000 %OK 49.7 (-> 1/2)
# The three-dimensional representation:
 #
# Here's how to get graphs, and the contour lines:
#
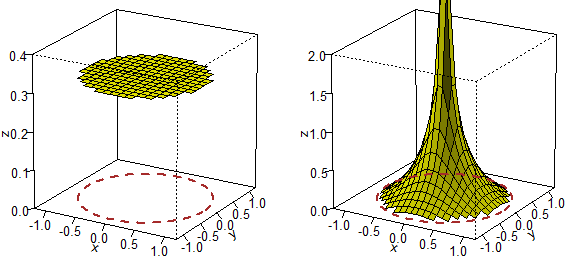
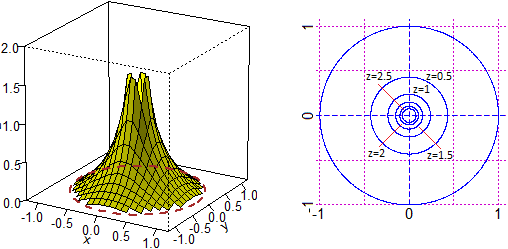
f = function(x,y) { u = sqrt(x^2+y^2); ifelse(u<=1,((0.5 * abs(u)^-0.5)-1/2)*6/pi,1/0) }
x1 = -1.2; x2 = 1.2; y1 = -1.2; y2 = 1.2; z12 = c(0,2)
x = seq(x1,x2,len=26); y = seq(y1,y2,len=26); z = outer(x, y, f)
BF=3; HF=3; NW(); MARG(0.2)
F = persp(x,y,z,zlim=z12,phi=20,theta=30,d=20,col="yellow",expand=1,ticktype="detailed",
cex.axis=0.8,cex.lab=0.8,shade=0.2)
t = seq(0,2*pi,len=200)
lines(trans3d(cos(t),sin(t), f(cos(t),sin(t)), F), col="brown", lwd=2, lty=2)
#
g = function(u) ((0.5 * abs(u)^-0.5)-1/2)*6/pi
PLANE(-1,1, -1,1)
circl(0,0,solution(g,0, 0.01,1),"blue")
circl(0,0,solution(g,0.5, 0.01,1),"blue")
circl(0,0,solution(g,1, 0.01,1),"blue")
circl(0,0,solution(g,1.5, 0.01,1),"blue")
circl(0,0,solution(g,2, 0.01,1),"blue")
circl(0,0,solution(g,2.5, 0.01,1),"blue")
#
# Here's how to get graphs, and the contour lines:
#
f = function(x,y) { u = sqrt(x^2+y^2); ifelse(u<=1,((0.5 * abs(u)^-0.5)-1/2)*6/pi,1/0) }
x1 = -1.2; x2 = 1.2; y1 = -1.2; y2 = 1.2; z12 = c(0,2)
x = seq(x1,x2,len=26); y = seq(y1,y2,len=26); z = outer(x, y, f)
BF=3; HF=3; NW(); MARG(0.2)
F = persp(x,y,z,zlim=z12,phi=20,theta=30,d=20,col="yellow",expand=1,ticktype="detailed",
cex.axis=0.8,cex.lab=0.8,shade=0.2)
t = seq(0,2*pi,len=200)
lines(trans3d(cos(t),sin(t), f(cos(t),sin(t)), F), col="brown", lwd=2, lty=2)
#
g = function(u) ((0.5 * abs(u)^-0.5)-1/2)*6/pi
PLANE(-1,1, -1,1)
circl(0,0,solution(g,0, 0.01,1),"blue")
circl(0,0,solution(g,0.5, 0.01,1),"blue")
circl(0,0,solution(g,1, 0.01,1),"blue")
circl(0,0,solution(g,1.5, 0.01,1),"blue")
circl(0,0,solution(g,2, 0.01,1),"blue")
circl(0,0,solution(g,2.5, 0.01,1),"blue")
 #
# Fore the graph on the left:
f = function(x,y) { u = sqrt(x^2+y^2);
ifelse(u<=1 & ((0.5 * abs(u)^-0.5)-1/2)*6/pi<=2.3,((0.5 * abs(u)^-0.5)-1/2)*6/pi,1/0) }
#
# How to get:
#
# Fore the graph on the left:
f = function(x,y) { u = sqrt(x^2+y^2);
ifelse(u<=1 & ((0.5 * abs(u)^-0.5)-1/2)*6/pi<=2.3,((0.5 * abs(u)^-0.5)-1/2)*6/pi,1/0) }
#
# How to get:
 f = function(x,y) { u = sqrt(x^2+y^2); ifelse(u<=1 ,1/pi,1/0) }
x1 = -1.2; x2 = 1.2; y1 = -1.2; y2 = 1.2; z12 = c(0,0.4)
x = seq(x1,x2,len=20); y = seq(y1,y2,len=20); z = outer(x, y, f)
BF=3; HF=3; NW(); MARG(0.2)
F = persp(x,y,z,zlim=z12,phi=20,theta=30,d=20,col="yellow",ticktype="detailed",
cex.axis=0.8,cex.lab=0.8,shade=0.2)
t = seq(0,2*pi,len=200)
lines(trans3d(cos(t),sin(t), 0, F), col="brown", lwd=2, lty=2)
f = function(x,y) { u = sqrt(x^2+y^2); ifelse(u<=1 ,1/pi,1/0) }
x1 = -1.2; x2 = 1.2; y1 = -1.2; y2 = 1.2; z12 = c(0,0.4)
x = seq(x1,x2,len=20); y = seq(y1,y2,len=20); z = outer(x, y, f)
BF=3; HF=3; NW(); MARG(0.2)
F = persp(x,y,z,zlim=z12,phi=20,theta=30,d=20,col="yellow",ticktype="detailed",
cex.axis=0.8,cex.lab=0.8,shade=0.2)
t = seq(0,2*pi,len=200)
lines(trans3d(cos(t),sin(t), 0, F), col="brown", lwd=2, lty=2)