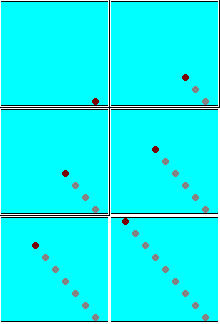
On the lefth: the movement perpendicular to the shore of a motionless canal.
On the right: the movement perpendicular to the shore of a flowing canal.
 |
↑ |
|
| ← |
 |
↑ |
|
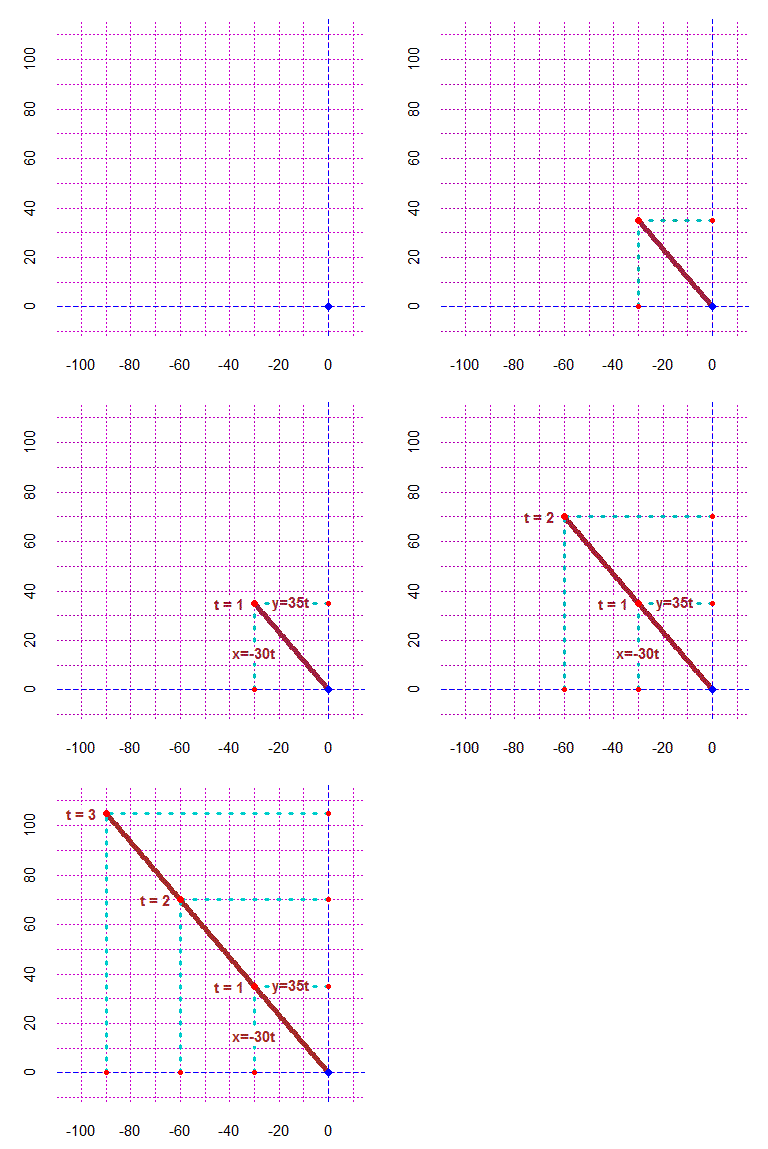
source("http://macosa.dima.unige.it/r.R")
# La figura:
HF=4; BF=4
PLANE(-105,10, -5,110)
POINT(0,0, "blue")
for(i in 0:200) {t <- 3/200*i; Point(-30*t,35*t,"brown")}
segm(0,35, -30,35, 0); segm(-30,0, -30,35, 0)
POINT(0,0, "blue")
t <- 1; type(-40,35,"t = 1")
POINT(-30*t,35*t, "red"); Point(0,35*t, "red"); Point(-30*t,0, "red")
type(-15,35,"y=35t"); type(-30,15,"x=-30t")
t <- 2; type(-70,70,"t = 2")
segm(0,35*t, -30*t,35*t, 0); segm(-30*t,0, -30*t,35*t, 0)
POINT(-30*t,35*t, "red"); Point(0,35*t, "red"); Point(-30*t,0, "red")
t <- 3; type(-90-10,105,"t = 3")
segm(0,35*t, -30*t,35*t, 0); segm(-30*t,0, -30*t,35*t, 0)
POINT(-30*t,35*t, "red"); Point(0,35*t, "red"); Point(-30*t,0, "red")


#
# The animated construction of the figure:
HF=4; BF=4
PLANE(-105,10, -5,110)
POINT(0,0, "blue"); wait(1/2)
for(i in 0:10) {t <- 3/210*i; wait(1/15); Point(-30*t,35*t,"brown")}
POINT(0,0, "blue")
for(i in 11:70) {t <- 3/210*i; wait(1/15); Point(-30*t,35*t,"brown")}
POINT(0,0, "blue")
t <- 1; segm(0,35, -30,35, 0); segm(-30,0, -30,35, 0)
text(-40,35,"t = 1",font=2,col="blue")
POINT(-30*t,35*t, "red"); Point(0,35*t, "red"); Point(-30*t,0, "red")
text(-15,35,"y=35t",font=2)
text(-30,15,"x=-30t",font=2)
for(i in 71:80) {t <- 3/210*i; wait(1/15); Point(-30*t,35*t,"brown")}
t <- 1; POINT(-30*t,35*t, "red")
for(i in 81:140) {t <- 3/210*i; wait(1/15); Point(-30*t,35*t,"brown")}
t <- 2; POINT(-30*t,35*t, "red"); segm(0,35*t, -30*t,35*t, 0); segm(-30*t,0, -30*t,35*t, 0)
Point(0,35*t, "red"); Point(-30*t,0, "red")
segm(0,70, -60,70, 0); segm(-60,0, -60,70, 0)
text(-70,70,"t = 2",font=2,col="blue")
for(i in 141:150) {t <- 3/210*i; wait(1/15); Point(-30*t,35*t,"brown")}
t <- 2; POINT(-30*t,35*t, "red")
for(i in 151:210) {t <- 3/210*i; wait(1/15); Point(-30*t,35*t,"brown")}
t <- 3; POINT(-30*t,35*t, "red"); segm(0,35*t, -30*t,35*t, 0); segm(-30*t,0, -30*t,35*t, 0)
Point(0,35*t, "red"); Point(-30*t,0, "red")
text(-90-10,105,"t = 3",font=2,col="blue")
t <- 3; POINT(-30*t,35*t, "red")
#
# The animated construction of the figure:
HF=4; BF=4
PLANE(-105,10, -5,110)
POINT(0,0, "blue"); wait(1/2)
for(i in 0:10) {t <- 3/210*i; wait(1/15); Point(-30*t,35*t,"brown")}
POINT(0,0, "blue")
for(i in 11:70) {t <- 3/210*i; wait(1/15); Point(-30*t,35*t,"brown")}
POINT(0,0, "blue")
t <- 1; segm(0,35, -30,35, 0); segm(-30,0, -30,35, 0)
text(-40,35,"t = 1",font=2,col="blue")
POINT(-30*t,35*t, "red"); Point(0,35*t, "red"); Point(-30*t,0, "red")
text(-15,35,"y=35t",font=2)
text(-30,15,"x=-30t",font=2)
for(i in 71:80) {t <- 3/210*i; wait(1/15); Point(-30*t,35*t,"brown")}
t <- 1; POINT(-30*t,35*t, "red")
for(i in 81:140) {t <- 3/210*i; wait(1/15); Point(-30*t,35*t,"brown")}
t <- 2; POINT(-30*t,35*t, "red"); segm(0,35*t, -30*t,35*t, 0); segm(-30*t,0, -30*t,35*t, 0)
Point(0,35*t, "red"); Point(-30*t,0, "red")
segm(0,70, -60,70, 0); segm(-60,0, -60,70, 0)
text(-70,70,"t = 2",font=2,col="blue")
for(i in 141:150) {t <- 3/210*i; wait(1/15); Point(-30*t,35*t,"brown")}
t <- 2; POINT(-30*t,35*t, "red")
for(i in 151:210) {t <- 3/210*i; wait(1/15); Point(-30*t,35*t,"brown")}
t <- 3; POINT(-30*t,35*t, "red"); segm(0,35*t, -30*t,35*t, 0); segm(-30*t,0, -30*t,35*t, 0)
Point(0,35*t, "red"); Point(-30*t,0, "red")
text(-90-10,105,"t = 3",font=2,col="blue")
t <- 3; POINT(-30*t,35*t, "red")
