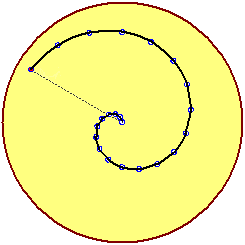
R = 0.5 t
α = 10° t
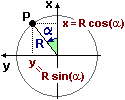
x = 0.5 t · cos(10°t)
y = 0.5 t · sin(10°t)
|
|   | x |
R = 0.5 t α = 10° t x = 0.5 t · cos(10°t) y = 0.5 t · sin(10°t) |
|
source("http://macosa.dima.unige.it/r.R")
HF=4; BF=4
# La curva in coordinate polari (R2 in funz. dell'angolo)
R1 <- function(sec) sec*0.5 # raggio in funz. del tempo in s
ang <- function(sec) 10*gradi*sec # angolo in funz. del tempo
sec <- function(ang) ang/(10*gradi) # tempo in funz. dell'angolo
R2 <- function(ang) R1(sec(ang)) # raggio in funz. dell'angolo
polarb(R2,0,10, "brown")
 #
# La figura animata, semplice:
PLANE(-30,30, -30,30)
for(i in 0:500) {t <- 55/500*i; wait(1/30); Point(0.5*t*cos(10*gradi*t),0.5*t*sin(10*gradi*t),"brown")}
#
# La figura animata, semplice:
PLANE(-30,30, -30,30)
for(i in 0:500) {t <- 55/500*i; wait(1/30); Point(0.5*t*cos(10*gradi*t),0.5*t*sin(10*gradi*t),"brown")}
 #
# La figura animata pił complessa:
BOXW(-30,30, -30,30) # boxmN(-30,30, -30,30)
X <- function(t) 0.5*t*cos(10*gradi*t)
Y <- function(t) 0.5*t*sin(10*gradi*t)
circle(0,0, 30, "blue")
for(i in 0:100) {
t0 <- 55/100*(i-1); t <- 55/100*i; wait(1/4); line(0,0, X(t0),Y(t0), "white"); line(0,0, X(t),Y(t), "red"); param(X,Y, 0,t, "brown") }
#
# La figura animata pił complessa:
BOXW(-30,30, -30,30) # boxmN(-30,30, -30,30)
X <- function(t) 0.5*t*cos(10*gradi*t)
Y <- function(t) 0.5*t*sin(10*gradi*t)
circle(0,0, 30, "blue")
for(i in 0:100) {
t0 <- 55/100*(i-1); t <- 55/100*i; wait(1/4); line(0,0, X(t0),Y(t0), "white"); line(0,0, X(t),Y(t), "red"); param(X,Y, 0,t, "brown") }