# Symbols that can be inserted in the charts. Examples.
#
BF=5; HF=1.5
boxW(0,9, 0,3)
#
text(1,2, 3^2 )
text(2,2, bquote(3^2) )
A=1/2
text(3,2, bquote(A) )
text(4,2, bquote( .(A) ) ) # [1]
text(5,2, bquote( frac(1,2)),cex=0.8,font=2) # [2]
text(6,2, bquote(3*2) ) # [3]
text(7,2, bquote(3%*%2) ) # [4]
text(8,2, bquote(3%.%2) ) # [5]
#
text(1,1, bquote(2*pi) ) # [6]
text(2,1, bquote( sqrt(2) ) )
for(i in 2:4) text(1+i,1, bquote( .(i)*pi ) )
for(i in 2:4) text(4+i,1, bquote( -.(i)*pi ) )
#
text(7.5,1.5, bquote( bold( A%*%B))) # [7]
#
text(1.5,1.5, bquote( y~"="~sqrt(x) ) ) # [8]
text(3.5,1.5, bquote( y~"="~sqrt(sqrt(scriptstyle(x))) ) )
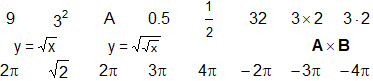 #
# As seen in [1], what is enclosed in .(…) is replaced by its value (0.5)
# As seen in [2], I can introduce symbols, eg. that of fraction (1/2)
# As seen in [3], with * I introduce a small space
# As seen in [5], I can introduce the product symbol with %.&
# As seen in [4], I can introduce the symbol "×" with %*&
# π and square root are introduced in the usual way (see [6])
#
# With "bold" I have the text in boldface (see [7])
#
# ~ introduces a blank space, scriptstyle types smaller characters (see [8])
#
# For other symbols see here.
#
# As seen in [1], what is enclosed in .(…) is replaced by its value (0.5)
# As seen in [2], I can introduce symbols, eg. that of fraction (1/2)
# As seen in [3], with * I introduce a small space
# As seen in [5], I can introduce the product symbol with %.&
# As seen in [4], I can introduce the symbol "×" with %*&
# π and square root are introduced in the usual way (see [6])
#
# With "bold" I have the text in boldface (see [7])
#
# ~ introduces a blank space, scriptstyle types smaller characters (see [8])
#
# For other symbols see here.