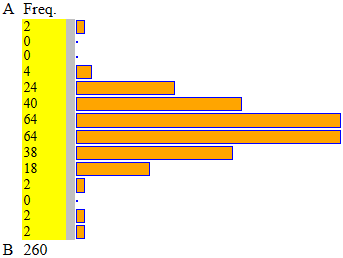
A = 1 B = 2.4 intervals = 14 of amplitude 0.1 - broad beans
1.35, 1.65, 1.80, 1.40, 1.65, 1.80, 1.40, 1.65, 1.85, 1.40, 1.65, 1.85, 1.50, 1.65, 1.90, 1.50, 1.65, 1.90, 1.50, 1.65, 1.90, 1.50, 1.70, 1.90, 1.50, 1.70, 1.90, 1.50, 1.70, 2.25, 1.55, 1.70, 1.55, 1.70, 1.55, 1.70, 1.60, 1.70, 1.60, 1.75, 1.60, 1.75, 1.60, 1.80, 1.60, 1.80, 1.60, 1.80, 1.60, 1.80, 1.00, 1.55, 1.70, 1.75, 1.30, 1.55, 1.70, 1.75, 1.40, 1.60, 1.70, 1.75, 1.40, 1.60, 1.70, 1.80, 1.40, 1.60, 1.70, 1.80, 1.40, 1.60, 1.70, 1.80, 1.40, 1.60, 1.70, 1.80, 1.40, 1.60, 1.70, 1.80, 1.40, 1.60, 1.70, 1.80, 1.40, 1.60, 1.70, 1.80, 1.45, 1.60, 1.70, 1.80, 1.50, 1.60, 1.70, 1.80, 1.50, 1.60, 1.70, 1.85, 1.50, 1.60, 1.70, 1.85, 1.50, 1.60, 1.75, 1.90, 1.50, 1.60, 1.75, 1.90, 1.50, 1.65, 1.75, 1.90, 1.55, 1.65, 1.75, 1.95, 1.55, 1.65, 1.75, 2.00, 1.55, 1.65, 1.75, 2.30, 1.35, 1.65, 1.80, 1.40, 1.65, 1.80, 1.40, 1.65, 1.85, 1.40, 1.65, 1.85, 1.50, 1.65, 1.90, 1.50, 1.65, 1.90, 1.50, 1.65, 1.90, 1.50, 1.70, 1.90, 1.50, 1.70, 1.90, 1.50, 1.70, 2.25, 1.55, 1.70, 1.55, 1.70, 1.55, 1.70, 1.60, 1.70, 1.60, 1.75, 1.60, 1.75, 1.60, 1.80, 1.60, 1.80, 1.60, 1.80, 1.60, 1.80, 1.00, 1.55, 1.70, 1.75, 1.30, 1.55, 1.70, 1.75, 1.40, 1.60, 1.70, 1.75, 1.40, 1.60, 1.70, 1.80, 1.40, 1.60, 1.70, 1.80, 1.40, 1.60, 1.70, 1.80, 1.40, 1.60, 1.70, 1.80, 1.40, 1.60, 1.70, 1.80, 1.40, 1.60, 1.70, 1.80, 1.40, 1.60, 1.70, 1.80, 1.45, 1.60, 1.70, 1.80, 1.50, 1.60, 1.70, 1.80, 1.50, 1.60, 1.70, 1.85, 1.50, 1.60, 1.70, 1.85, 1.50, 1.60, 1.75, 1.90, 1.50, 1.60, 1.75, 1.90, 1.50, 1.65, 1.75, 1.90, 1.55, 1.65, 1.75, 1.95, 1.55, 1.65, 1.75, 2.00, 1.55, 1.65, 1.75, 2.30
Having introduced the data, and used [CLICK], with [minimum], [maximum], [median], [mean] I get:
mean = 1.6592307692308
median (2^ quarter, in the middle of the sorted data) = 1.65
1^ quarter: 1.55, 3^ quarter: 1.75
width of the central half = 0.2
maximum = 2.3
minimum = 1
n = 260
If then I choose 1 as "A", 2.4 as "B" and 14 as "number of intervals", and click [histogram] (and put "broad beans" as title), I get:
The width of the central half (the distance between the 1st and 3rd quarter, 0.2 in this case) gives an idea of the width of the area where the data is concentrated. In this example, 50% of the beans are between 1.55 cm and 1.75 cm long.
Alternatively, if I had the data already classified, I could enter it in the following form, obtaining the same result.
1*2, 1.3*2, 1.35*2, 1.4*22, 1.45*2, 1.5*24, 1.55*16, 1.6*42, 1.65*22, 1.7*42, 1.75*22, 1.8*30, 1.85*8, 1.9*16, 1.95*2, 2*2, 2.25*2, 2.3*2
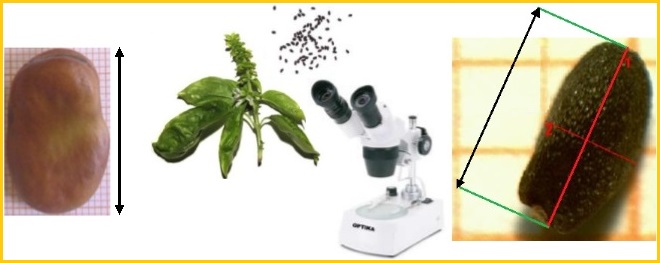
Below on the left the image of a bean seed placed on a sheet of graph paper to measure its length. On the right the image of how another class measured the length of basil seeds using a stereomicroscope, which gives values with many digits (only a few significant ones). Below the measures collected by the class.
1.944474, 2.176403, 2.381037, 1.971069, 2.178466, 2.389039, 1.980298, 2.222064, 2.400560, 2.005266, 2.233202, 2.403857, 2.047079, 2.256341, 2.414356, 2.063478, 2.257275, 2.441692, 2.073464, 2.264273, 2.441809, 2.075890, 2.279626, 2.501192, 2.080611, 2.282354, 2.524316, 2.097085, 2.288252, 2.575395, 2.112226, 2.293673, 2.602342, 2.141965, 2.299742, 2.654032, 2.142679, 2.301457, 2.663396, 2.144709, 2.305893, 2.665530, 2.156164, 2.345941, 2.739415, 2.161602, 2.364831, 2.762354, 1.827547, 2.122749, 2.273763, 1.855254, 2.141668, 2.274085, 1.861674, 2.148191, 2.277117, 1.874470, 2.149251, 2.279401, 1.883268, 2.151697, 2.302933, 1.885252, 2.176491, 2.309115, 1.891458, 2.178452, 2.335834, 1.907743, 2.179811, 2.336312, 1.943342, 2.181266, 2.339914, 1.967000, 2.188731, 2.348716, 1.975734, 2.194292, 2.353246, 1.979976, 2.196575, 2.395220, 1.996646, 2.204940, 2.406590, 2.002445, 2.205823, 2.416860, 2.015793, 2.208185, 2.427837, 2.016699, 2.224770, 2.440977, 2.032486, 2.226911, 2.457101, 2.033379, 2.231072, 2.458355, 2.045551, 2.232692, 2.459751, 2.052005, 2.234695, 2.479710, 2.069424, 2.237457, 2.482356, 2.072091, 2.238444, 2.574592, 2.098704, 2.267303, 2.667822, 2.104753

| The study of the cast of a die made of thin cardboard: |  |
| The exits obtained with 200 launches: |
5,5,4,3,3,1,6,2,5,6,2,5,3,6,5,6,3,2,1,6,1,6,6,3,5,2,1,5,2,5,5,3,6,6,4,6,6,5,6,2, 1,6,6,3,2,2,5,6,3,2,6,6,6,4,2,3,6,6,6,2,6,4,5,4,6,2,3,5,6,6,2,2,1,5,5,3,5,3,5,6, 2,1,4,3,6,6,6,4,3,4,6,6,4,5,4,4,2,2,6,4,4,6,2,5,3,6,6,3,3,2,2,6,1,4,6,5,3,3,4,1, 6,4,6,6,2,5,5,1,5,2,6,5,2,2,4,1,2,2,6,1,6,5,5,6,1,3,3,4,5,5,5,6,4,4,6,3,6,3,6,6, 4,2,6,6,6,1,4,5,6,5,6,5,5,5,6,6,2,1,6,3,6,6,5,3,5,2,2,4,6,6,5,2,5,5,6,6,5,2,6,1

I put 0.5 and 6.5 as extremes of the interval so as to have little intervals centered in 1, 2, 3, 4, 5, 6.
Evidently, it's not a well-balanced die.