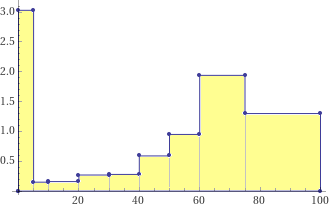
In Italia nel 1951, nelle fasce di età
[0,5),[5,10),[10,20),[20,30),[30,40),[40,50),[50,60),[60,75),[75,100)
sono morte 729,35,77,132,134,285,457,1401,1569 migliaia di persone. L'istogramma rappresenta le frequenze percentuali unitarie:
le frequenze percentuali divise per l'ampiezza di ciascun interallo, così che l'area di ciascun rettangolo verticale rappresenti
la frequenza percentuale delle uscite che cadono nell'intervallo che ne è alla base. La somma delle aree dei rettangoli è 100.
In Italy in 1951, in
the age intervals [0,5),[5,10),[10,20),[20,30),[30,40),[40,50),[50,60),[60,75),[75,100)
are dead 729,35,77,132,134,285,457,1401,1569 thousand people. The histogram represents
the unitary percentage frequencies: the percentage frequencies divided by the
amplitude of each interval, so that the area of each vertical rectangle represents the percentage
frequency of the outputs that fall in the interval that is the base. The sum of the
areas of the rectangles is 100. |
 |
sum(729,35,77,132,134,285,457,1401,1569)
   4819
round((729/5, 35/5,77/10, 132/10,134/10,285/10,457/10,1401/15,1569/25)/4819*100, 0.01)
{3.03, 0.15, 0.16, 0.27, 0.28, 0.59, 0.95, 1.94, 1.3} |
| plot (0;0),(0;3.03),(5;3.03),(5;.15),(10;.15),(10;.16),(20;.16),(20;.27),(30;.27),(30;.28),(40;.28),(40;.59), (50;.59),(50;.95), (60;.95),(60;1.94), (75;1.94),(75;1.3), (100;1.3),(100;0),(0;0) | |
Se voglio cliccando [Customize] e scegliendo [Image Size] "Medium" posso salvare l'immagine in dimensioni maggiori
If I want by clicking [Customize] and choosing [Image Size] "Medium" I can save the image in a larger size
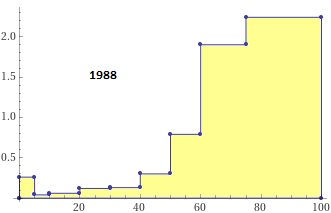
 È evidente il cambiamento rispetto alla fine del XIX secolo, così come il successivo cambiamento alla fine del XX secolo.
The change from the end of the 19th century is evident, as is the subsequent change at the end of the 20th century.
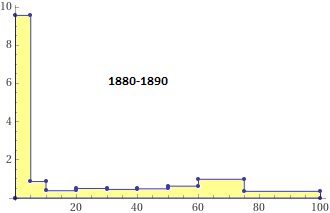
1880-1890
sum(3818,343,303,398,360,384,495,1177,708)
    7986
1988
sum(68,10,31,66,70,161,423,1516,2983)
    5328
plot (0;0),(0;9.56),(5;9.56),(5;.86),(10;.86),(10;.38),(20;.38),(20;.5),(30;.5),(30;0.45),(40;0.45),(40;.48),(50;.48),(50;.62),(60;.62),(60;.98),(75;.98),(75;.35),(100;.35),(100;0),(0;0)
plot (0;0),(0;.26),(5;.26),(5;.04),(10;.04),(10;.06),(20;.06),(20;.12),(30;.12),(30;.13),(40;.13),(40;.3),(50;.3),(50;.79),(60;.79),(60;1.9),(75;1.9),(75;2.24),(100;2.24),(100;0),(0;0)
Un altro esempio: come in Europa nel 1970 era distribuita la lunghezza (in cm) della circonferenza toracica dei bambini maschi di 3 anni.
Another example: the statistical distribution of the length (in cm) of the chest circumference of 3-year-old boys in Europe in 1970.
percentili / percentiles
| 94% of the measurements |
| | 80% | |
| | 50% | |
| 3° | 10° | 25° | 50° | 75° | 90° | 97° |
| 48.9 | 49.9 | 51.0 | 52.4 | 54.1 | 55.8 | 57.9 |
|
|
 |
interv: [47,48.9),[48.9,49.9),[49.9,51.0),[51.0,52.4),[52.4,54.1),[54.1,55.8),[55.8,57.9),[57.9,60)
% freq:     3,         7,         15,          25,        25,         15,          7,         3
sum(3,7,15,25,25,15,7,3)
100
round((3/(48.9-47),7/(49.9-48.9),15/(51-49.9),25/(52.4-51),25/(54.1-52.4),15/(55.8-54.1),7/(57.9-55.8),3/(60-57.9)),0.1)
{1.6, 7, 13.6, 17.9, 14.7, 8.8, 3.3, 1.4}
plot (47;0),(47;1.6),(48.9;1.6),(48.9;7),(49.9;7),(49.9;13.6),(51;13.6),(51;17.9),(52.4;17.9),(52.4;14.7),(54.1;14.7),(54.1;8.8),(55.8;8.8),(55.8;3.3),(57.9;3.3),(57.9;1.4),(60;1.4),(60;0),(47;0)
Come era distribuita l'altezza (in cm) degli stessi bambini.
How the height (in cm) of the same children was distributed.
percentili / percentiles
| 94% of the measurements |
| | 80% | |
| | 50% | |
| 3° | 10° | 25° | 50° | 75° | 90° | 97° |
| 90.6 | 92.3 | 93.9 | 96.2 | 98.5 | 100.5 | 102.8 |
|
|
 |
interv: [87,90.6),[90.6,92.3),[92.3,93.9),[93.9,96.2),[96.2,98.5),[98.5,100.5),[100.5,102.8),[102.8,106)
% freq:     3,         7,         15,          25,        25,         15,          7,         3
round((3/(90.6-87),7/(92.3-90.6),15/(93.9-92.3),25/(96.2-93.9),25/(98.5-96.2),15/(100.5-98.5),7/(102.8-100.5),3/(106-102.8)),0.1)
{0.8, 4.1, 9.4, 10.9, 10.9, 7.5, 3, 0.9}
plot (87;0),(87;.8),(90.6;.8),(90.6;4.1),(92.3;4.1),(92.3;9.4),(93.9;9.4),(93.9;10.9),(96.2;10.9),(96.2;10.9),(98.5;10.9),(98.5;7.5),(100.5;7.5),(100.5;3),(102.8;3),(102.8;.9),(106;.9),(106;0),(87;0)
L'altezza si distribuisce in modo pressocché simmetrico (anzi, gaussiano) rispetto alla verticale passante per il valore mediano (96.2), mentre la circonferenza toracica (come il peso) no.
Height is distributed almost symmetrically (indeed, Gaussian) with respect to the vertical passing through the median value (96.2), while the chest circumference (like the weight) does not.